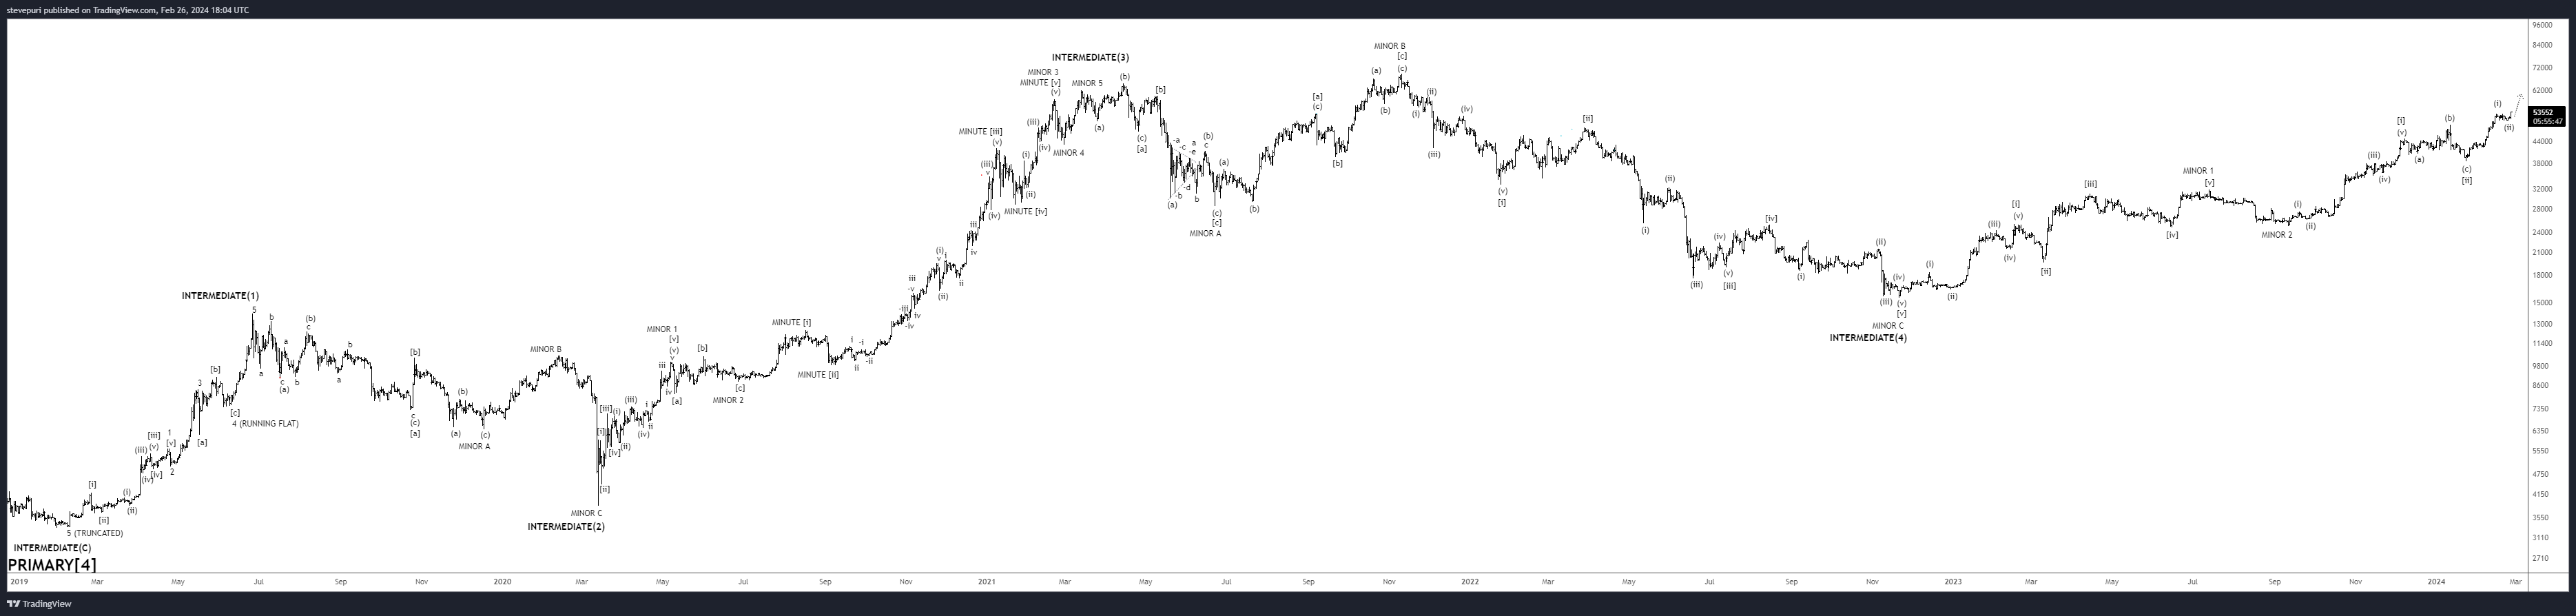
There is a wave, a pullback, from 11-JAN-2024 to 23-JAN-2024, a -21.50% decline, which your first option is overlooking perhaps ?
Completely correct, and in fact I was favouring my model "2" until the 56.5k dip happened just for this reason.However, while the pullback in January was significant regarding the "depth" of the correction, with over 20% loss, it was very short compared to the mid-2023 pullback (31->25k) and the current pullback (73-56.5). The January pullback lasted less than two weeks, while the other two, which I thus favour to be the 2 and 4 bearish waves were much longer (the current pullback will soon be 2 months long). We could thus explain the January pullback simply as a period of higher-than-normal volatility inside a minor pullback due to the ETF decisions.
But I don't rule out that model 2 is still the one to follow. Would be of course more bullish. If 56.5k was the bottom there are still chances that this model holds.
The model you're favouring, which is my item 3, is of course also not impossible. This would be basically equivalent to the "Supercycle" or "this time it's different" theory. But I have slight doubts about it. I also think I disagree that the peak of this wave would be the end of the uptrend since 2011. IMO such long cycles in the case of a novel asset like Bitcoin can only be evaluated taking into account the real adoption/success.