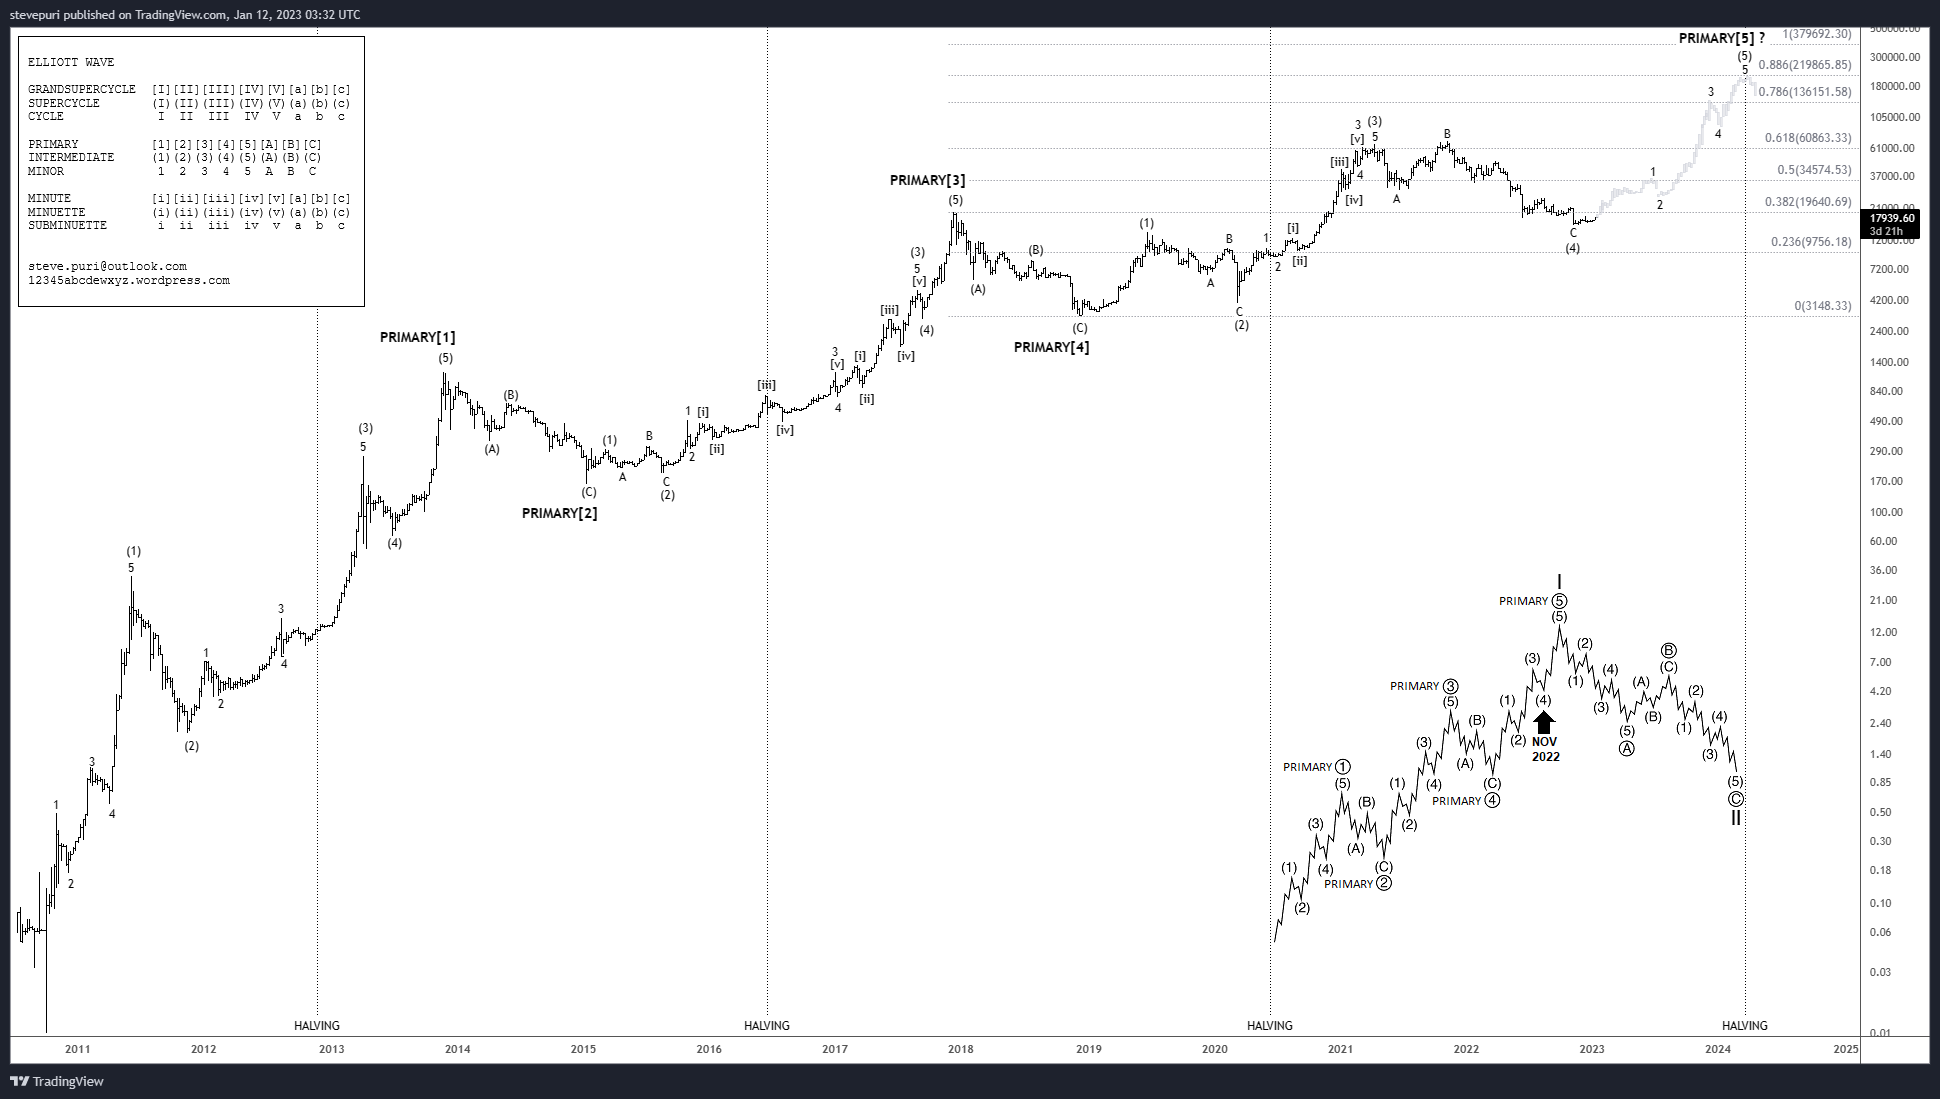
Curious that your count for Bitcoin has us starting Wave 5 but Wave 3 for equities. Do you see a great decoupling to come or is it just there's no time frame data to be gleaned from the counts (i..e differing wave counts could play out within the same time frame)?
Each market, each asset class, each stock, is in their own Elliott Wave trajectory. There are times when markets correlate, and there are times when markets decouple.
There are variations in wave degree where markets may correlate with each other, but one market could be in say PRIMARY[3] and an other market in INTERMEDIATE(3) degree —both in bull markets, but the at the time of correction, one leads with a steeper decline and slower recovery. E.g.
—Japan NIKKEI225 index was decoupled from the rest of the developed equities world in the 1990s for decades onwards, re-aligned in 2009.
—Bitcoin greatly decoupled from the S&P500 and global equity markets starting in 2014 for a year, and started to correlate with gold.
—Gold has usually been, and thought of, as a decoupled hedge against equites, but has been correlated since 2015.
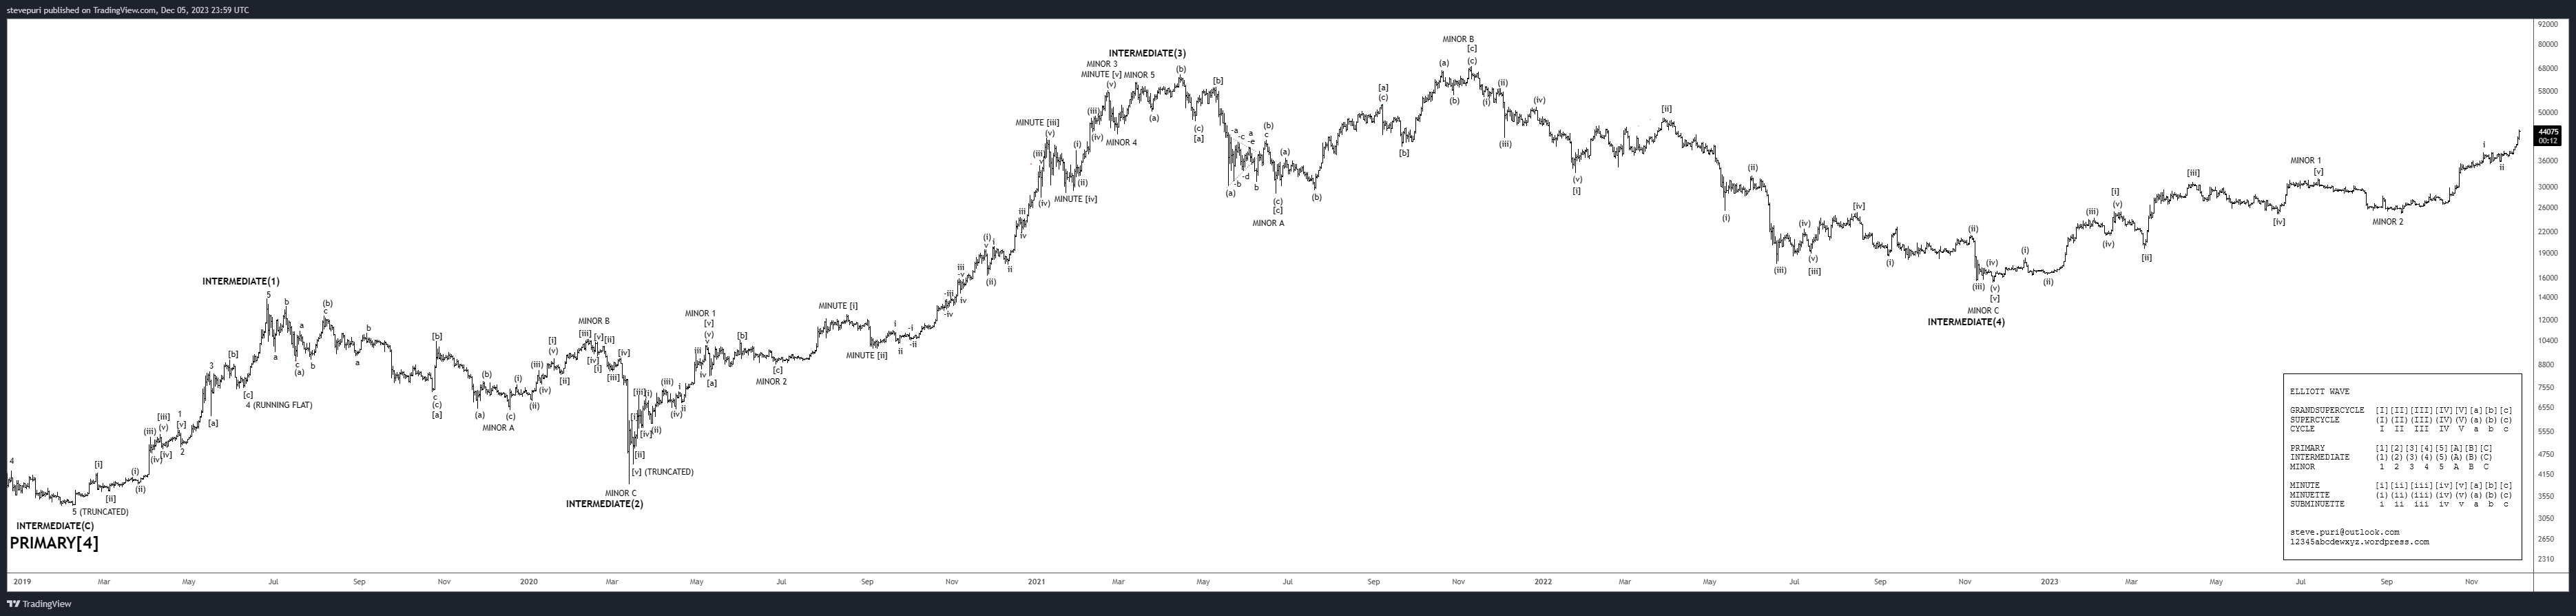
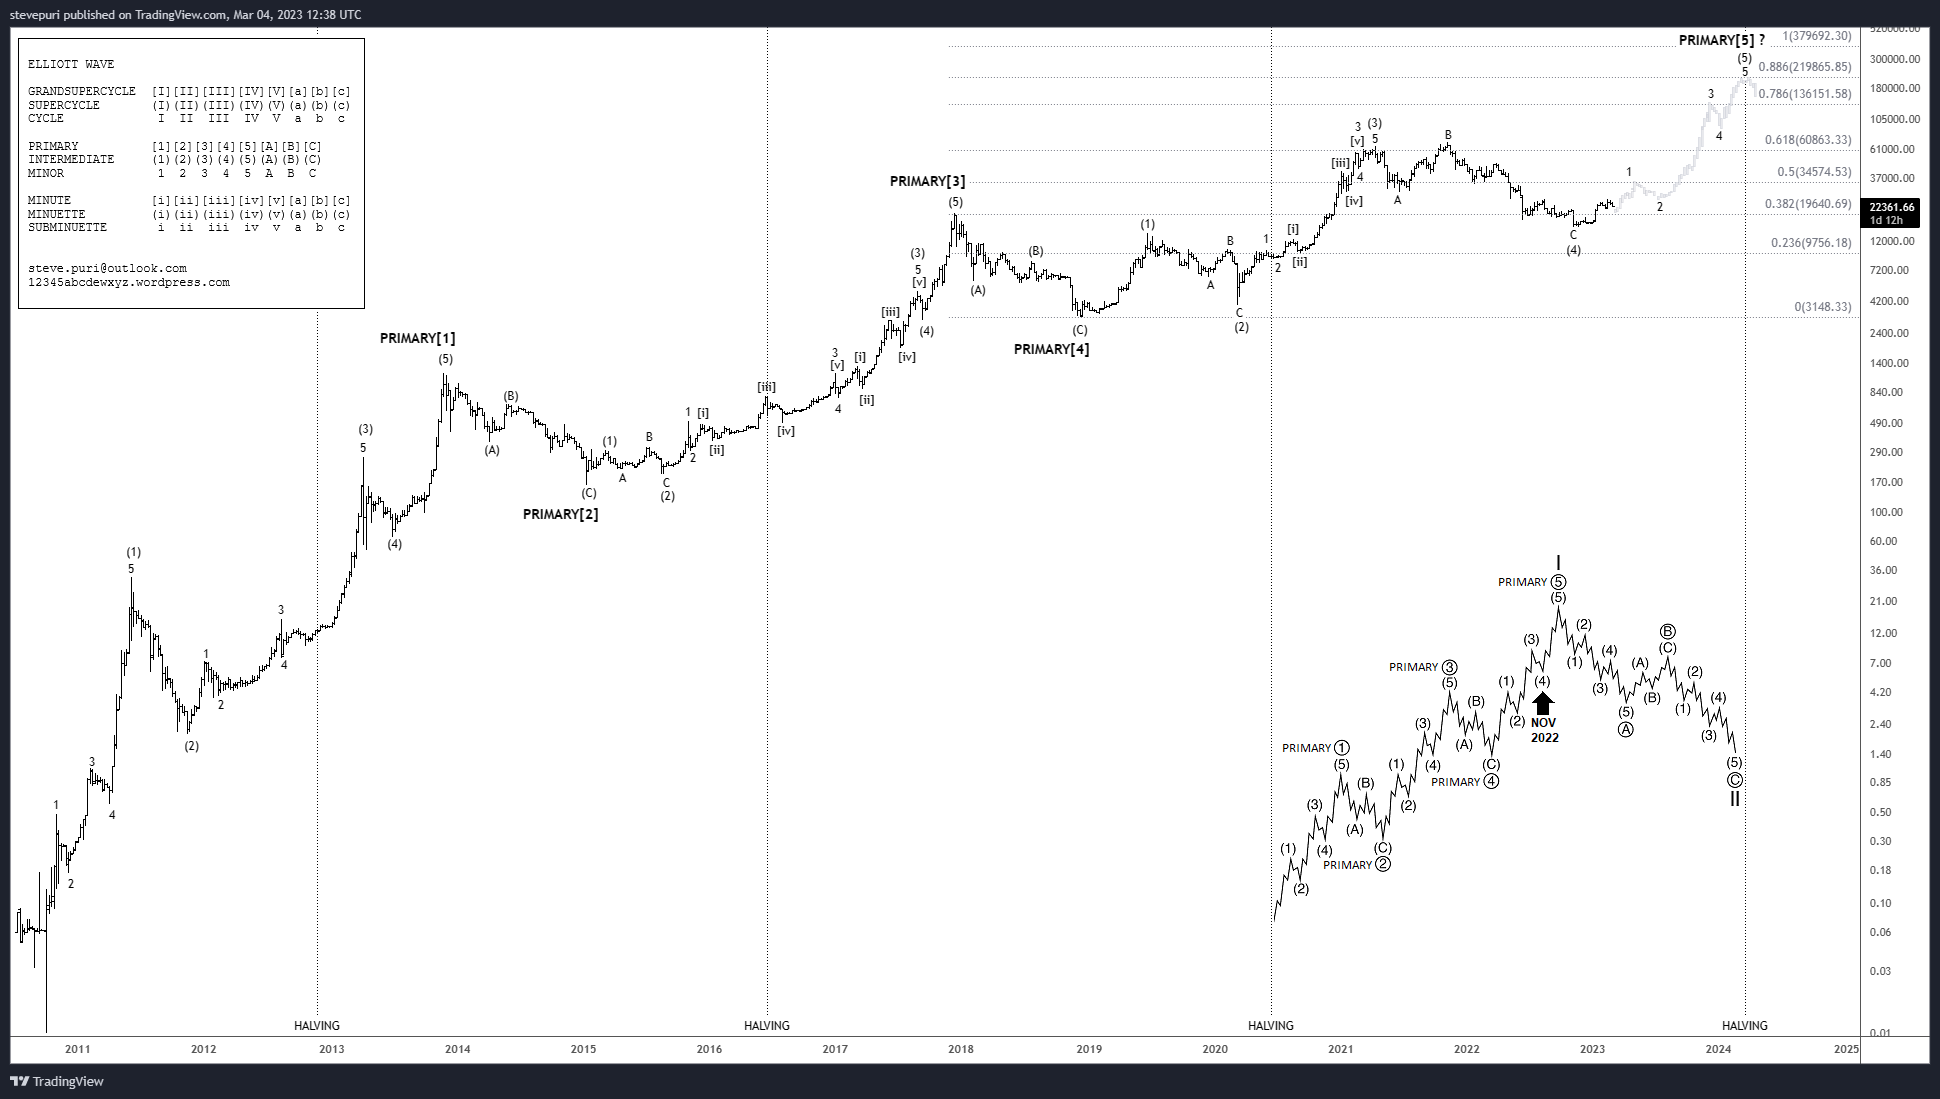
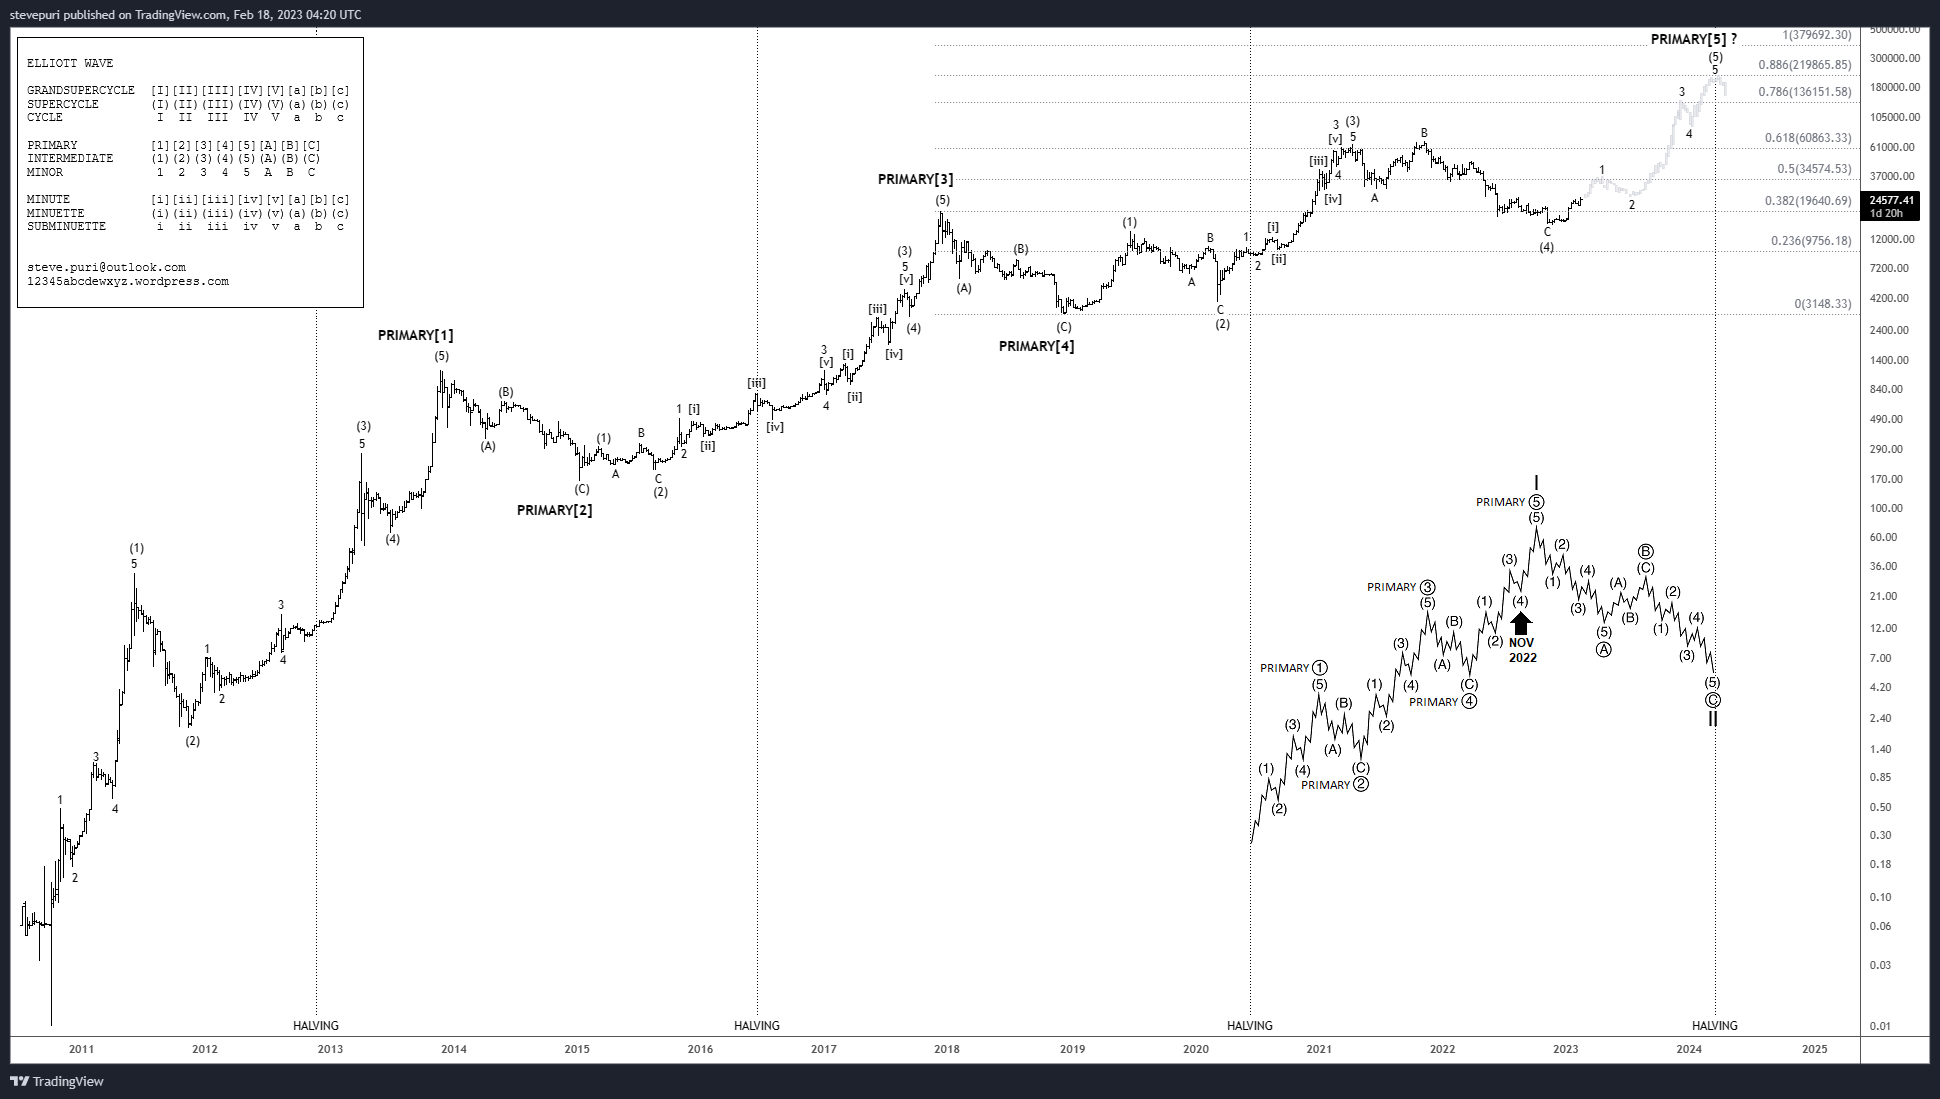
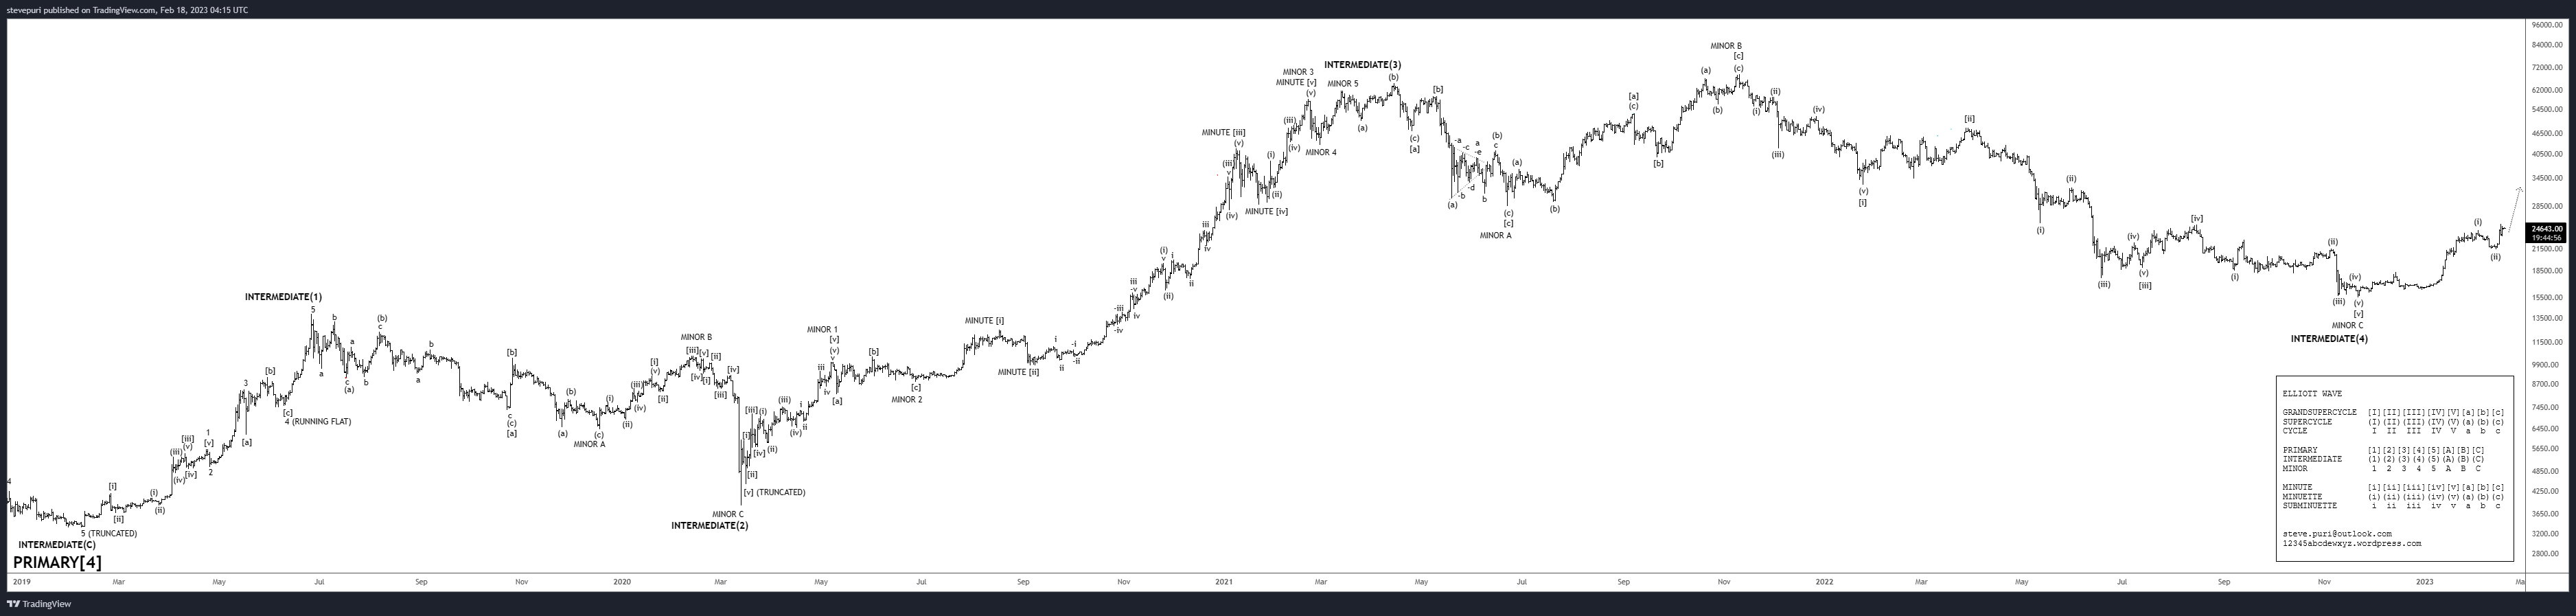
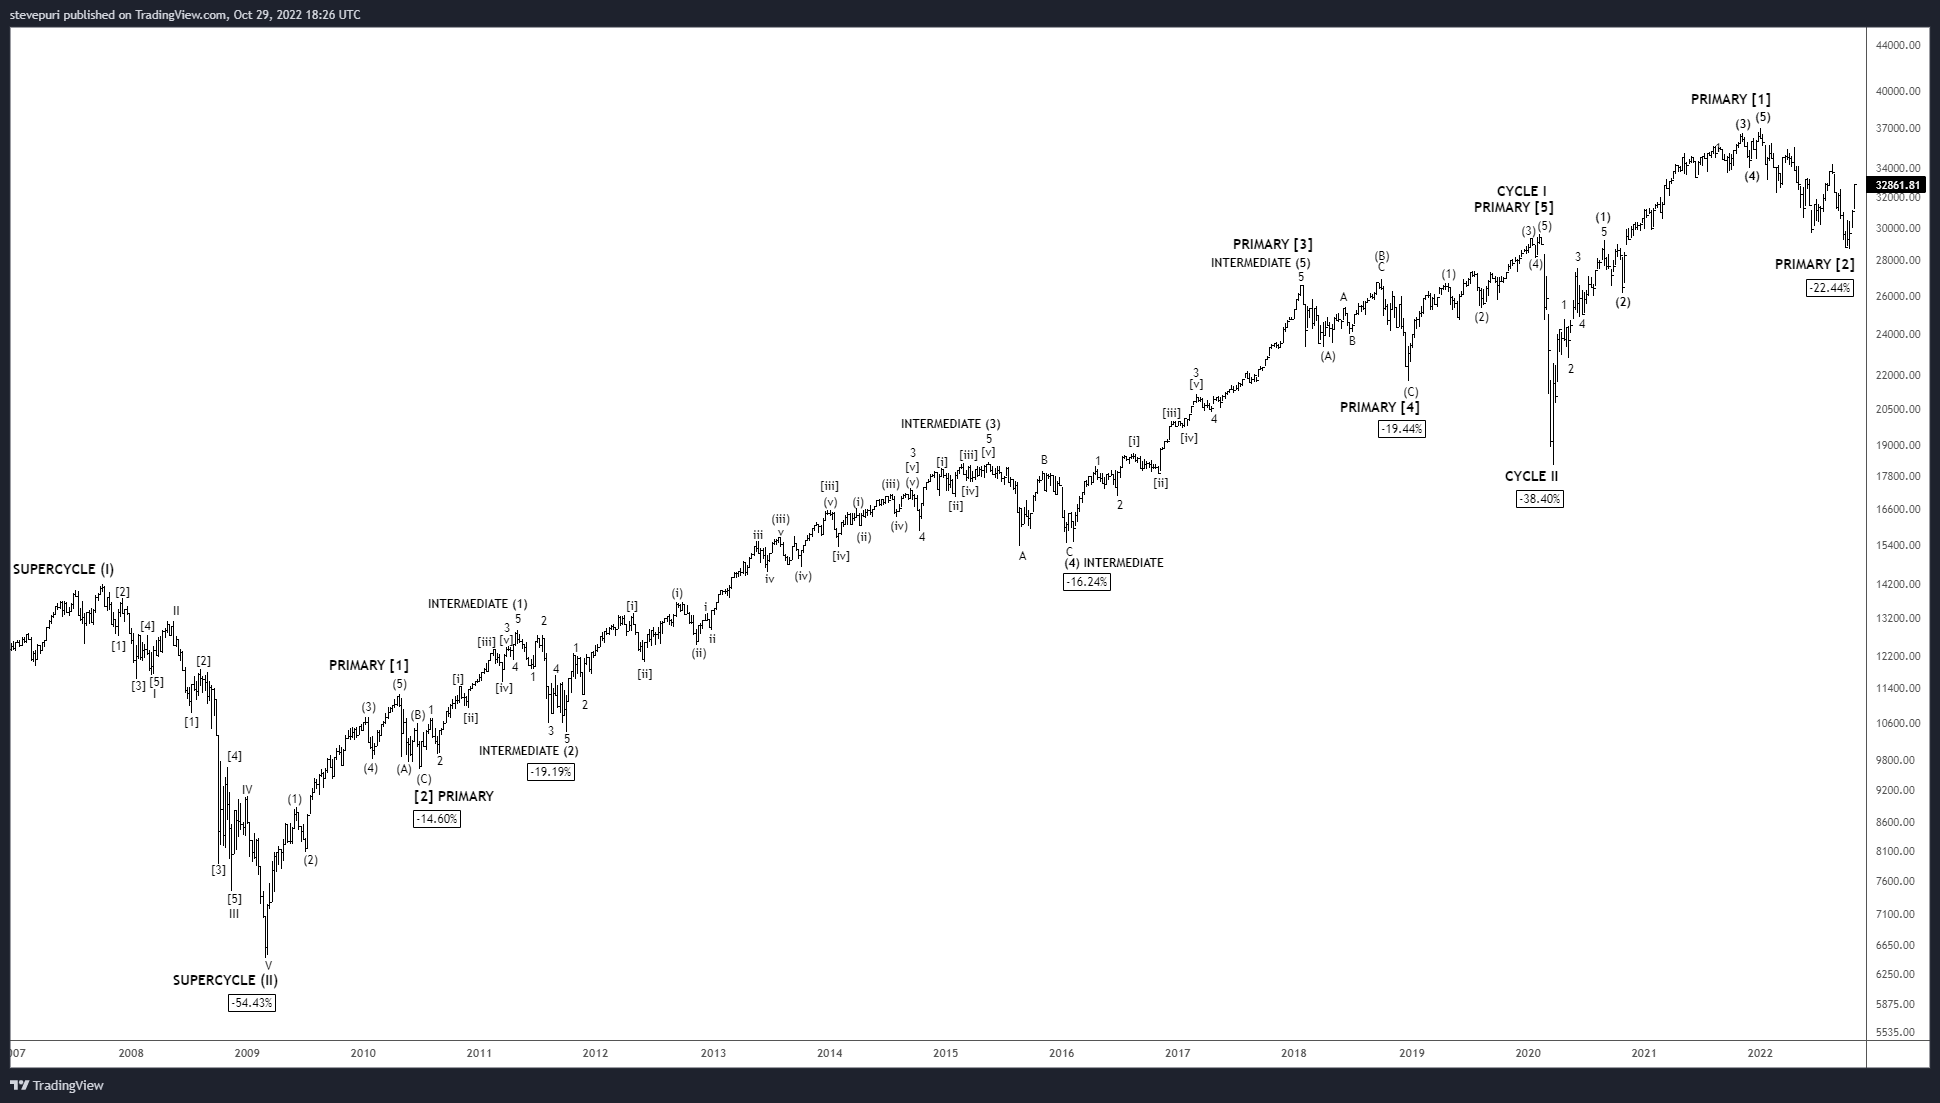
Interestingly, the current PRIMARY[5]→INTERMEDIATE(5) wave in Bitcoin could be the longest wave within PRIMARY[5]. This would be a reverse symmetry of the wave lengths (in terms of percentages) that occurred in PRIMARY[1] wave; i.e. the waves within PRIMARY[1] contracted, and the waves within PRIMARY[5] are expanded...