


I don’t know if you are new to trading or not but one thing I will tell you is that you can’t trade on technical analysis alone. It barely works 50% of the time. Remember. If it was just as simple as looking at a pattern, wouldn’t everybody do it ?
It doesn’t work that way. You need to use more indicators and sentiment. When we are very bullish then there is a good chance a bullish pattern will work. If we are bearish then most likely a bullish pattern won’t work and vice versa. You need to get a general sense of what the market is doing and then use TA to enter a trade.
BitcointalkSearch
Search easily and fast between all the Bitcointalk topics content.
What's this?

Bitcointalksearch.org - what's this site?
It was the Bitcointalk forum that inspired us to create Bitcointalksearch.org - Bitcointalk is an excellent site that should be the default page for anybody dealing in cryptocurrency, since it is a virtual gold-mine of data. However, our experience and user feedback led us create our site; Bitcointalk's search is slow, and difficult to get the results you need, because you need to log in first to find anything useful - furthermore, there are rate limiters for their search functionality.
The aim of our project is to create a faster website that yields more results and faster without having to create an account and eliminate the need to log in - your personal data, therefore, will never be in jeopardy since we are not asking for any of your data and you don't need to provide them to use our site with all of its capabilities.
We created this website with the sole purpose of users being able to search quickly and efficiently in the field of cryptocurrency so they will have access to the latest and most accurate information and thereby assisting the crypto-community at large.

Author
Topic: Time to buy or sell? - page 9. (Read 1370 times)

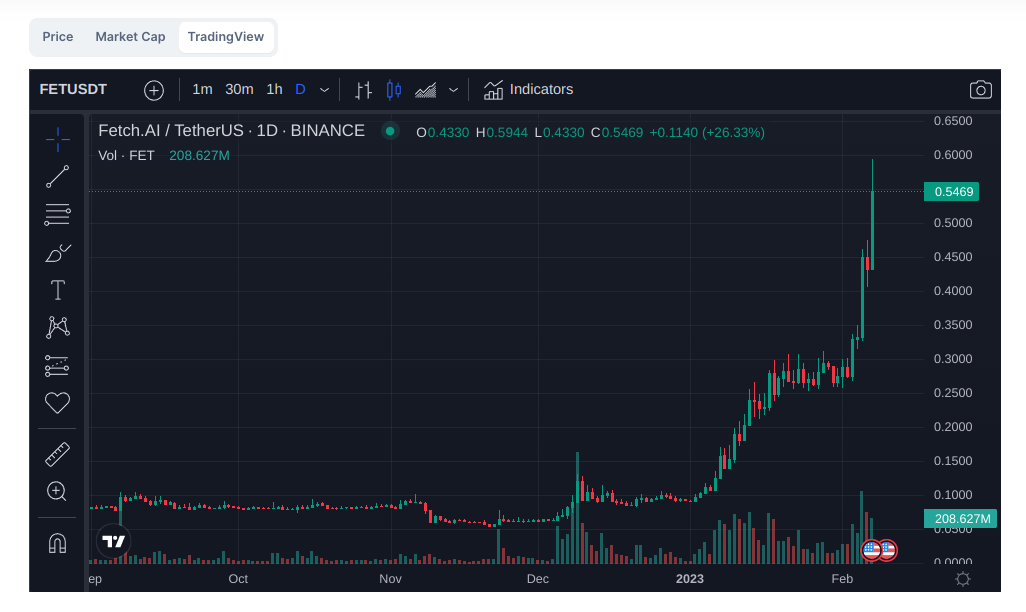
According to the following image, is it the Pennant?
I generally think it's better to be able to spot a pattern than it is to name it. It becomes a lot easier to find new ones that work well if you can teach yourself how to spot them and test they'll be successful (only going off what you have seen in the past - don't try to randomly guess things it's a skill that takes a long time to develop).
In this example I wonder why you've called it a pennant and not a "measured move up", they would both act very similar but I think the latter would be easier to trade because you're not waiting to a lower low like the pennant implies.

According to the following image, is it the Pennant?
Code:
[url=https://i.postimg.cc/Mpn0KRfY/Crypto-Chart-Patterns.jpg][img width=200 height=300]https://i.postimg.cc/Mpn0KRfY/Crypto-Chart-Patterns.jpg[/img][/url]
[url=https://i.postimg.cc/zBS4wzYb/FET-1.png][img width=400 height=200]https://i.postimg.cc/zBS4wzYb/FET-1.png[/img][/url]
[url=https://i.postimg.cc/zBS4wzYb/FET-1.png][img width=400 height=200]https://i.postimg.cc/zBS4wzYb/FET-1.png[/img][/url]
If you are having trouble posting images with URL, please follow this code. You can also use [img] without width and height, it's up to you. I have seen your profile and seems like you have no problem posting image but here you just posted the links. As you can see, you can click the image, and it will take you to the original image.
Now coming to the point for chart analysis. You have to do it on your own. No one here will give you any signals or advice on when to buy or sell. It's a risk you have to take on your own. Do your own research and compare them to the chart. No one else will take that risk for you. You are on your own here mate.
Depends on how you approach the market and honestly, where are you during the bear market?
I’m wondering why many are not buying during the bear market where in fact, that was the best time to buy more and hold more. Now that the price is rising, many rushing into this marker as if they are going to missed something. If you are bullish right now and see a lot of good opportunities, better to buy now and wait for the bull trend.
I’m wondering why many are not buying during the bear market where in fact, that was the best time to buy more and hold more. Now that the price is rising, many rushing into this marker as if they are going to missed something. If you are bullish right now and see a lot of good opportunities, better to buy now and wait for the bull trend.
Hello,
I found following Crypto chart patterns:
https://i.postimg.cc/Mpn0KRfY/Crypto-Chart-Patterns.jpg
According to the following image, is it the Pennant?
https://i.postimg.cc/zBS4wzYb/FET-1.png
I found following Crypto chart patterns:
https://i.postimg.cc/Mpn0KRfY/Crypto-Chart-Patterns.jpg
According to the following image, is it the Pennant?
https://i.postimg.cc/zBS4wzYb/FET-1.png
You may want to trade. But I can see usdt in your chart but all coins depend on Bitcoin. And you have downloaded the crypto chart from the website. So research yourself well and start trading.
https://www.newtraderu.com/2022/03/07/crypto-chart-patterns/
Personally, I don't follow the patterns religiously. Most of the time they are misleading.
Yes, the pattern can be misleading, I know of a guy that short APT recently at $17, the coin increased from $3.03 to $20.03, the guy short it at $17, thinking the price will start to decrease. Only what he noticed was that the coin increased from $17 to $20.03 and he close the trade at $19. Although, the coin later in days dropped from $20.3 to $14.4 yesterday, but the market was very volatile and made him panicked and he lost. There are sometimes that someone can think it is bear market for a coin already, but the coin might continue to increase in price, a massive bull run can make bears asset to continue to liquidate.
It seems like a pennant, but if you are to base on that pattern right now for your short term trades. It's too late for you. Just wait for another formation to come up. The coin already pumped and we might see a correction.
Personally, I don't follow the patterns religiously. Most of the time they are misleading.
Personally, I don't follow the patterns religiously. Most of the time they are misleading.
That pattern will not work in the long term it only works in the short time.
Nowadays is not easy to predict the crypto price movement analyzing the market only helps you decide and know when to buy or sell sometimes analyzing them will work but sometimes it doesn't always keep in your mind that Crypto is unpredictable.
As you can see in your chart with Fetch.ai/Tether and most of the tokens/coins out there they are rising due to the recent bitcoin rise.
If I were you since you don't know yet how to analyze the coin/token learn about FA and TA and some strategies from this link below and don't worry few tools from that link is free where you can test your skills and strategies.
- https://github.com/SpiralDevelopment/Awesome-Crypto-Trading
Trading formations work only half of the time. If you watch some of the youtube guys they always come up with a pattern after it confirms and when they come up with a pattern before the confirmation it's a shot in the dark. When it doesn't work they even delete the videos or change them so it looks like they were more consistent and leave only videos that confirmed.
Go to 12 h chart on bitcoin between June and September 2022 and you'll find a perfect example of rising waves pattern which in your link is bullish and ends with a buy signal but in bitcoin it crashed down.
I don't trade anymore but if you ask me if you should buy or sell now it means you're scared and holding bitcoin. If that makes you uncomfortable and you have a profit of more than 10% just sell and wait until you gain more confidence. Better be safe than sorry.
If you are trading, know that it is like you are gambling, trading is not gambling because with trading, you can use indicators and make some analyses to predict where the market is going. I noticed some altcoins like GRT, AGIX, FET, FSX and OCEAN to have increased significantly recently, even when bitcoin is not increasing. If you use the 4 hours candle stick, it is like the market may still decreased, but that depend on bitcoin too and indicator can fail. If bitcoin start another bull run, those coins can increase more, but slight decrease in bitcoin will result to massive decrease on those coins. But some traders will still prefer to sell it.
Hello,
I found following Crypto chart patterns:
https://i.postimg.cc/Mpn0KRfY/Crypto-Chart-Patterns.jpg
According to the following image, is it the Pennant?
https://i.postimg.cc/zBS4wzYb/FET-1.png
Thank you.
I found following Crypto chart patterns:
https://i.postimg.cc/Mpn0KRfY/Crypto-Chart-Patterns.jpg
According to the following image, is it the Pennant?
https://i.postimg.cc/zBS4wzYb/FET-1.png
Thank you.
Jump to: