Pages:
Author

Topic: Is Bitcoin's price "basically a fire sale"? - page 3. (Read 378 times)

hero member
Activity: 3038
Merit: 617


I am doing my best JJG.

I  DCA weekly at  this time.

I consider any price under $22,222.22 as weekly dca territory

How is it now?
Just like you, I tried DCAing when the price bounced at $29000 but eventually its dipping this this low.  I would be very careful this time not to waste my stablecoin. In the last bear market, the price of BTC dips at about -80% which it may also be possible this time which could be $10000.

$20000 sure its fire sale. Anything beyond that is more than black friday sale.
legendary
Activity: 2506
Merit: 1394
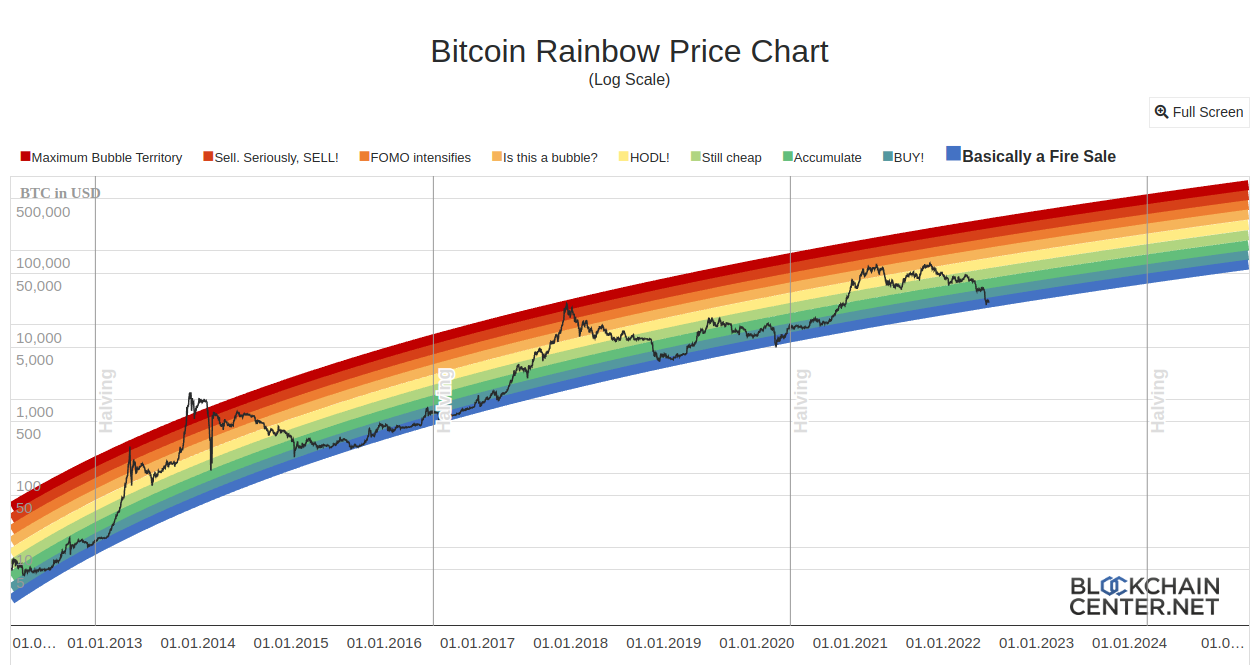
This kind of chart is one of the many reasons why the current price level of Bitcoin is a good buy, if you also take a look at the Fear and Greed index, it is still showing that good to buy too.
To be honest, there are still a lot of people who are afraid and we can't blame them. Even though we will say that it's in the sale, we cannot do something.
copper member
Activity: 2856
Merit: 3071
https://bit.ly/387FXHi lightning theory
While we've seen other models more or less break, or become irrelevant, such as Stock to Flow and Logarithmic Growth Curve, but do you think the Bitcoin Rainbow chart is still accurate?

I think we'll see movements inversely proportional to bitcoin's inflation but I don't think any model is going to be very accurate on predicting bitcoin's price for a while.

Waiting for one to be invalidated is going to be a bit problematic too - but the pattern of when inflation reduces, price increases has always held and has more reason to be held.

The rainbow chart looks a lot more flexible too with bitcoin's price though (like how it's fallen out of the bottom of the rainbow before so an event like that would be noteworthy but not the end of the model).
member
Activity: 112
Merit: 83
I am doing my best JJG.

I  DCA weekly at  this time.

I consider any price under $22,222.22 as weekly dca territory
legendary
Activity: 1722
Merit: 2213
While we've seen other models more or less break, or become irrelevant, such as Stock to Flow and Logarithmic Growth Curve, but do you think the Bitcoin Rainbow chart is still accurate?


Although based on a logarithmic growth curve, it does appear to be more accurate than the alternative log growth that effectively became invalidated in March 2020 (despite price recovering afterwards). Currently the model suggests that price is "basically a fire sale" around $20K, with current bubble territory @ $240K and a maximum low of $41K by the next halving in 2024.

It otherwise consider <$37K as accumulation territory and $50K as still cheap, which feels a bit ironic at current prices. What are your thoughts?

Pages:
Jump to: