BitcointalkSearch
Search easily and fast between all the Bitcointalk topics content.
What's this?

Bitcointalksearch.org - what's this site?
It was the Bitcointalk forum that inspired us to create Bitcointalksearch.org - Bitcointalk is an excellent site that should be the default page for anybody dealing in cryptocurrency, since it is a virtual gold-mine of data. However, our experience and user feedback led us create our site; Bitcointalk's search is slow, and difficult to get the results you need, because you need to log in first to find anything useful - furthermore, there are rate limiters for their search functionality.
The aim of our project is to create a faster website that yields more results and faster without having to create an account and eliminate the need to log in - your personal data, therefore, will never be in jeopardy since we are not asking for any of your data and you don't need to provide them to use our site with all of its capabilities.
We created this website with the sole purpose of users being able to search quickly and efficiently in the field of cryptocurrency so they will have access to the latest and most accurate information and thereby assisting the crypto-community at large.

Author
Topic: 2021 Elliott Wave (Read 3727 times)


..
if so, the MINOR-2 wave MINUTE [iii] is going to be spectacular, I could probably do a x2 or more
from your mouth to god's ears.
..
if so, the MINOR-2 wave MINUTE [iii] is going to be spectacular, I could probably do a x2 or more


2021 Elliott Wave
Speculatively forecasting the price of Bitcoin via subjectively using the Elliott Wave principle.
Analysis is conjecture with sporadic fortnightly to monthly updates.
Previous thread: 2019 Cryptocurrency (Elliott Wave)
Subjective in the general view is still in the speculation stage, meaning that prices are not completely correct, analysis is a prediction made based on previous experience, but many people are starting to understand how to predict correctly, although sometimes predictions are not all correct with what actually happened, according to the graph of what what I see from the right is more stable than the left, maybe by the end of 2021 everything will look good. - https://www.reddit.com/r/BitcoinMarkets/comments/kkhby9/2021_elliott_wave
- https://12345abcdewxyz.wordpress.com
Speculatively forecasting the price of Bitcoin via subjectively using the Elliott Wave principle.
Analysis is conjecture with sporadic fortnightly to monthly updates.
Previous thread: 2019 Cryptocurrency (Elliott Wave)


I have to say that @xxxx123abcxxxx has a lot of patience to answer so many questions. I even asked him long ago what the subsequent bear market would be like, how long and at what price level it could go. It will be good to take it into account in a few months, when it is clear that we have already made the top.
The bear market declines in Bitcoin since inception have been: -94%, -87%, -85% —hence the average being -89%
If say the current bull market ends around $220K to complete CYCLE-I by 2022, then a -89% decline for CYCLE-II ought to end above the 2017 high.
Anybody's guess what happens, perhaps Bitcoin ceases to exist? The following may illustrate the popular opinion of a perpetual market...

@ josegines,
thank you for your questions,
and
@ xxxx123abcxxxx
many thanks for your answers
it is very instructive
thank you for your questions,
and
@ xxxx123abcxxxx
many thanks for your answers
it is very instructive
I have to say that @xxxx123abcxxxx has a lot of patience to answer so many questions. I even asked him long ago what the subsequent bear market would be like, how long and at what price level it could go. It will be good to take it into account in a few months, when it is clear that we have already made the top.
@ josegines,
thank you for your questions,
and
@ xxxx123abcxxxx
many thanks for your answers
it is very instructive
thank you for your questions,
and
@ xxxx123abcxxxx
many thanks for your answers
it is very instructive
Okay, I had not understood that you were talking about Easter, so it coincides with what I am saying, that right now you see the end of this bullish cycle on Dec/21 or on Easter/22 (April/22)
But the count you have drawn ends on Dec/21, if it were delayed it would be because there would be some corrective wave that lasts longer than expected right now. Or maybe because some impulsive wave extended.
We will have to see the evolution week by week, to try to clear the doubt of whether the end will be in December or later.
Or maybe we won't know when December arrives, but weeks later.
If it is true that if in December we see an explosive wave that rises too vertical, it would be a sign of the end.
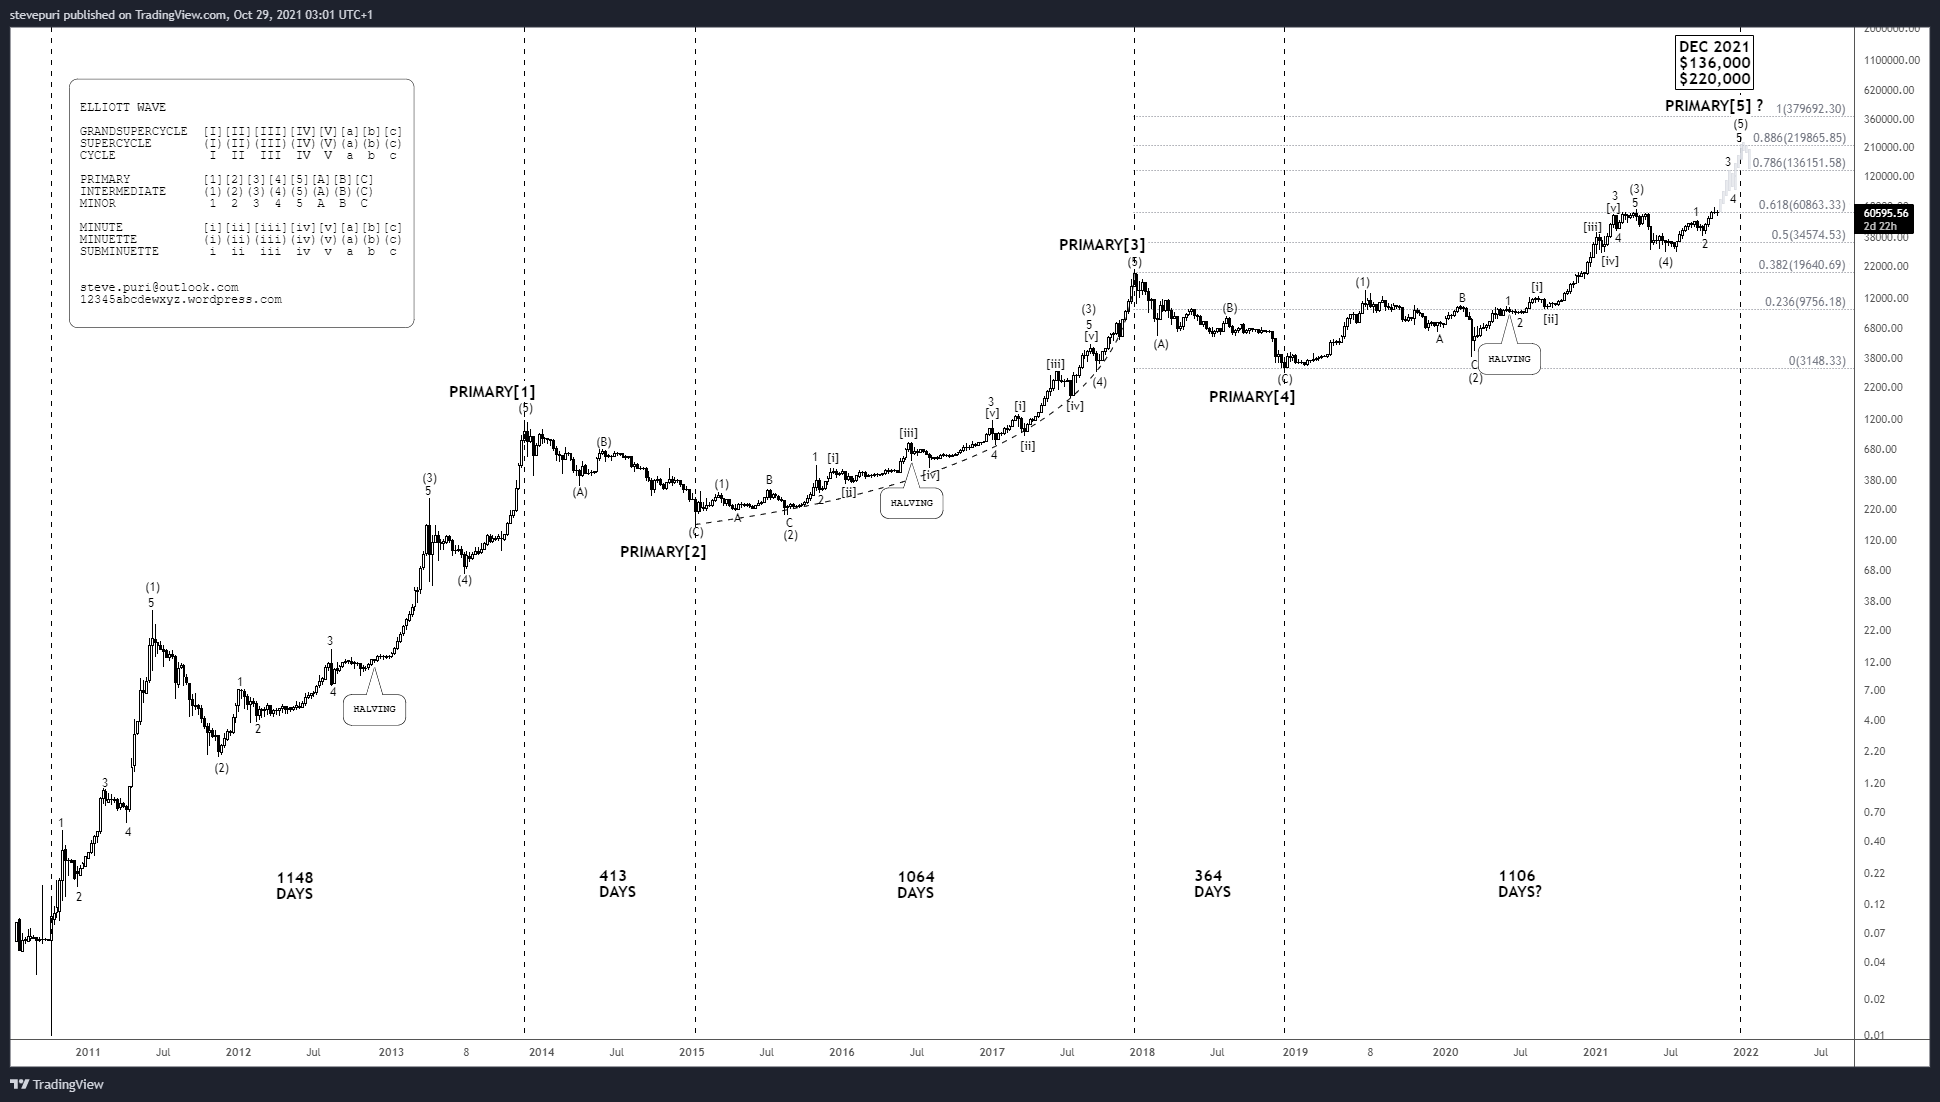
The simplest and conservative outlook of this Elliott Wave model suggests an end to the bull market either around 136K or around 220K. Perhaps either around Christmas 2021 or around Easter 2022.
This means...
—the bull market may end around 136K, around Christmas 2021; or,
—the bull market may end around 220K, around Christmas 2021; or,
—the bull market may end around 220K, around Easter 2022 or earlier.
The chart simply illustrates the 'average' of the aforementioned scenarios.
Who knows, some are expecting 500K next year! As and when the waves develop, the projections shall be adjusted.
Your suggestion would look like the following chart...
https://i.ibb.co/NpDV6QV/btcusd.png
Unlikely for the following reasons...
—It is rare for MINOR 1 wave to be the largest. It would mean MINOR 3 and MINOR 5 would have to be successively smaller since the third wave in a sequence cannot be the shortest.
—The proposed MINOR 2 pullback is almost equivalent in magnitude to the INTERMEDIATE(2) pullback. Therefore, the proposed MINOR 2 pullback is better suited to be considered as INTERMEDIATE(4) pullback. The most conservative and simplest counts are considered first until eliminated.
Okay, I had not understood that you were talking about Easter, so it coincides with what I am saying, that right now you see the end of this bullish cycle on Dec/21 or on Easter/22 (April/22)
But the count you have drawn ends on Dec/21, if it were delayed it would be because there would be some corrective wave that lasts longer than expected right now. Or maybe because some impulsive wave extended.
We will have to see the evolution week by week, to try to clear the doubt of whether the end will be in December or later.
Or maybe we won't know when December arrives, but weeks later.
If it is true that if in December we see an explosive wave that rises too vertical, it would be a sign of the end.
I was referring to this other (3), but I am not an expert on Elliot, I was only thinking about the possibilities that the climb would last until spring.
I suppose that a possibility that we have a little more than 2 months of rise, is that the waves that remain, are extended.
I suppose that the count that I have put in the image could be confirmed, if after reaching the predicted (5) and correcting, the price again exceeds the level of that predicted (5)
https://i.imgur.com/RNpPMdP.jpg
Your suggestion would look like the following chart...
https://i.ibb.co/NpDV6QV/btcusd.png
Unlikely for the following reasons...
—It is rare for MINOR 1 wave to be the largest. It would mean MINOR 3 and MINOR 5 would have to be successively smaller since the third wave in a sequence cannot be the shortest.
—The proposed MINOR 2 pullback is almost equivalent in magnitude to the INTERMEDIATE(2) pullback. Therefore, the proposed MINOR 2 pullback is better suited to be considered as INTERMEDIATE(4) pullback. The most conservative and simplest counts are considered first until eliminated.
It seems that if we are doing (5), it will end in December(only 2 months), it does not seem to last any longer.
But would there be chances that we are doing (3) instead of (5), and thus the top of this bull cycle will be delayed to March-April / 2022?
I understand that as you have the count no, but I imagine that there could be possibilities to redo the count.
I am thinking that we may be close to a very important moment, nothing less than we could have the new ATH in just 2 months. It is too close!!!
Thanks for your explanation!
Current estimation is for the PRIMARY[5] bull market to end either by around Christmas 2021 or around Easter 2022, with initial expectations of around 136K or 220K as a top.
Your suggestion of (5) actually being a (3) would look like the following chart...
https://i.ibb.co/LYmSQSD/BTCUSD.png
Such an extended count would take the PRIMARY[5] bull market well beyond the Halving in 2024. Historically, there has never been a Halving at all-time highs during a core bull market. Is it possible? Sure. However, best to eliminate the more conservative counts first before jumping ahead.
I was referring to this other (3), but I am not an expert on Elliot, I was only thinking about the possibilities that the climb would last until spring.
I suppose that a possibility that we have a little more than 2 months of rise, is that the waves that remain, are extended.
I suppose that the count that I have put in the image could be confirmed, if after reaching the predicted (5) and correcting, the price again exceeds the level of that predicted (5)

It seems that if we are doing (5), it will end in December(only 2 months), it does not seem to last any longer.
But would there be chances that we are doing (3) instead of (5), and thus the top of this bull cycle will be delayed to March-April / 2022?
I understand that as you have the count no, but I imagine that there could be possibilities to redo the count.
I am thinking that we may be close to a very important moment, nothing less than we could have the new ATH in just 2 months. It is too close!!!
Thanks for your explanation!
But would there be chances that we are doing (3) instead of (5), and thus the top of this bull cycle will be delayed to March-April / 2022?
I understand that as you have the count no, but I imagine that there could be possibilities to redo the count.
I am thinking that we may be close to a very important moment, nothing less than we could have the new ATH in just 2 months. It is too close!!!
Thanks for your explanation!
Current estimation is for the PRIMARY[5] bull market to end either by around Christmas 2021 or around Easter 2022, with initial expectations of around 136K or 220K as a top.
Your suggestion of (5) actually being a (3) would look like the following chart...
https://i.ibb.co/LYmSQSD/BTCUSD.png
Such an extended count would take the PRIMARY[5] bull market well beyond the Halving in 2024. Historically, there has never been a Halving at all-time highs during a core bull market. Is it possible? Sure. However, best to eliminate the more conservative counts first before jumping ahead.
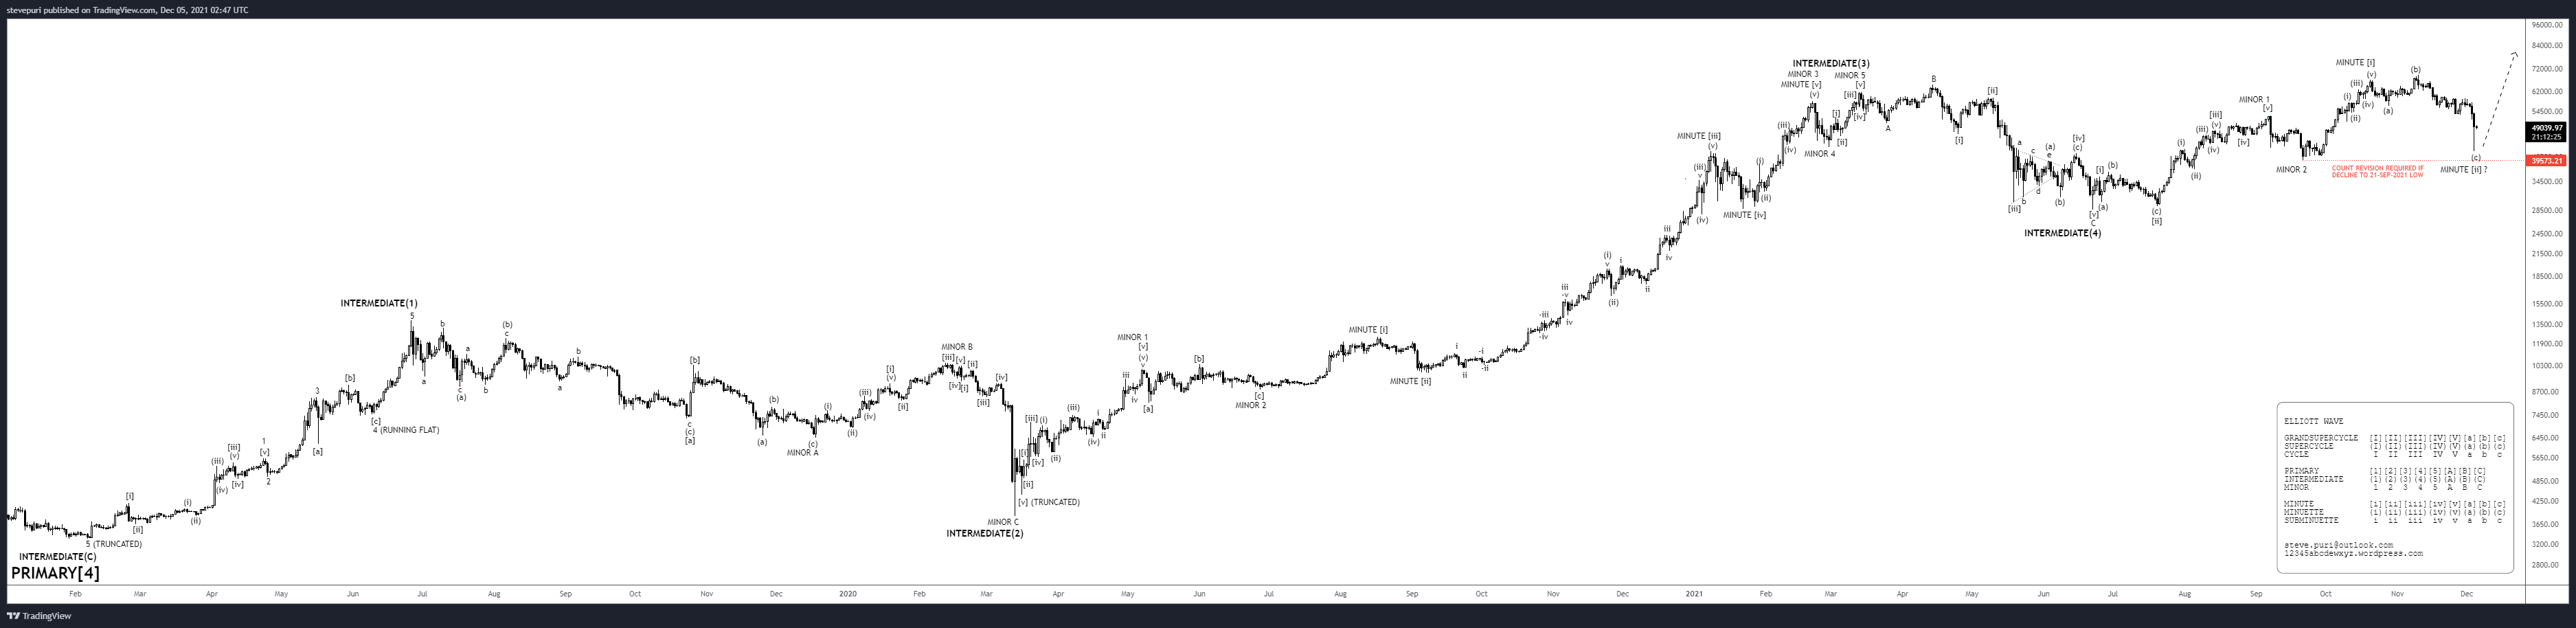
The count is always subject to review. For example, if a wave subdivides and extends, then a wave-4 pullback could actually be a wave-2 pullback. Hence, the degree of a wave is always uncertain until a substantial countermove occurs in the trend.
MINOR 2 pullback was -25% in size. Therefore, the expectation is that MINOR 3 uptrend ought to have pullbacks limited to sub -25% in size. If there is a pullback of around -25% within MINOR 3 wave, then it either means MINOR 3 is subdividing, or MINOR 4 is underway, or the entire structure is revised to one degree lower. In terms of size, there is an initial expectation that MINOR 3 is going to extend MINOR 1 by 1.618% in size —i.e. at least $100K in price. Given the aforementioned points, an estimation of the wave count can be attempted, subject to revision.
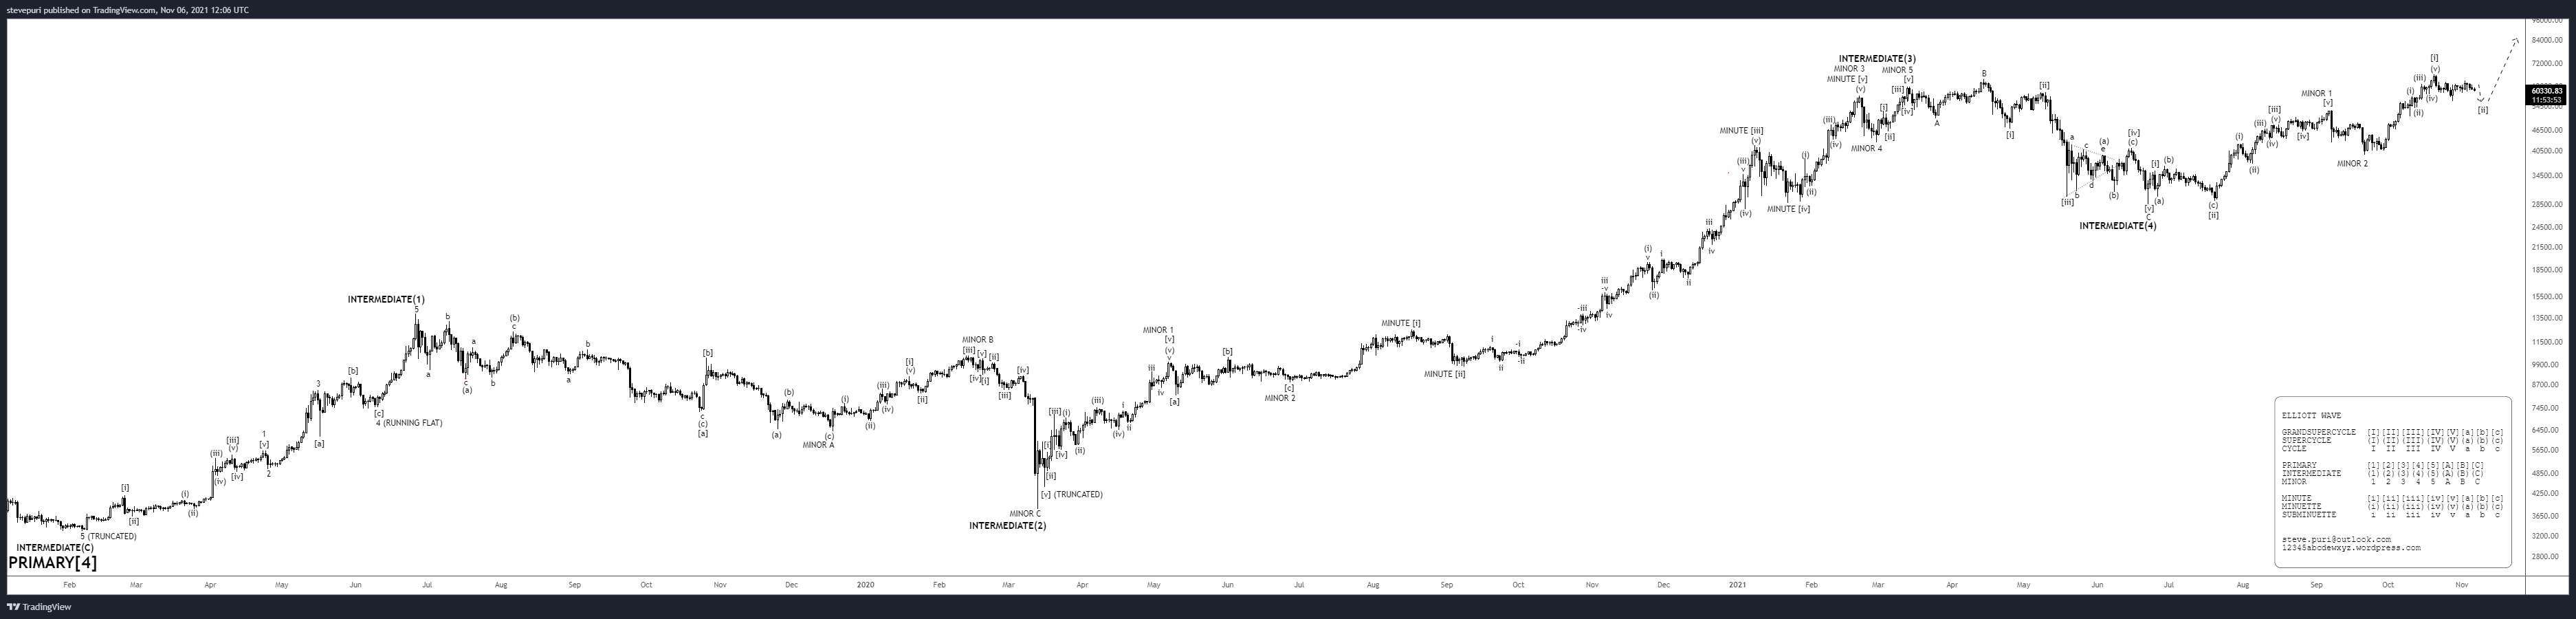
Start with the 'bigger picture' and identify the notable countertrend moves —these will be either wave-2 or wave-4 pullbacks. And then you can start filling-in the gaps to identify and label the other waves...
It seems that if we are doing (5), it will end in December(only 2 months), it does not seem to last any longer.
But would there be chances that we are doing (3) instead of (5), and thus the top of this bull cycle will be delayed to March-April / 2022?
I understand that as you have the count no, but I imagine that there could be possibilities to redo the count.
I am thinking that we may be close to a very important moment, nothing less than we could have the new ATH in just 2 months. It is too close!!!
Thanks for your explanation!
I am impressed that you can already do a count when there has barely been a major correction, I suppose you make a reviewable approximation if we see that a major correction starts.
That is, now the price could do fundamentally 2 things, it can break the previous ATH with little correction or it can correct something, for example looking for the 7 / Sep high at $ 52,700 (MINOR 1 Top), and then break the ATH
I mean that now you can be reasonably clear that we would be in MINOR 3, but to know the development of that MINOR 3, I thought you would need a boost and its correction to be seen more clearly. Of course I don't have your skill to see those waves in MINOR 3.
That is, it could be the case that yesterday a maximum was made and a correction of several days began, and it would continue to be valid for the MINOR 3
The count is always subject to review. For example, if a wave subdivides and extends, then a wave-4 pullback could actually be a wave-2 pullback. Hence, the degree of a wave is always uncertain until a substantial countermove occurs in the trend.
MINOR 2 pullback was -25% in size. Therefore, the expectation is that MINOR 3 uptrend ought to have pullbacks limited to sub -25% in size. If there is a pullback of around -25% within MINOR 3 wave, then it either means MINOR 3 is subdividing, or MINOR 4 is underway, or the entire structure is revised to one degree lower. In terms of size, there is an initial expectation that MINOR 3 is going to extend MINOR 1 by 1.618% in size —i.e. at least $100K in price. Given the aforementioned points, an estimation of the wave count can be attempted, subject to revision.
Start with the 'bigger picture' and identify the notable countertrend moves —these will be either wave-2 or wave-4 pullbacks. And then you can start filling-in the gaps to identify and label the other waves...

Do you think we are still in the first wave of MINOR 3 or do we have to wait for a correction to find out more?
When the rise stops, if we are still in the first wave, how much would be the minimum correction of the second wave? 23.6%?
Thanks!
When the rise stops, if we are still in the first wave, how much would be the minimum correction of the second wave? 23.6%?
Thanks!

I am impressed that you can already do a count when there has barely been a major correction, I suppose you make a reviewable approximation if we see that a major correction starts.
That is, now the price could do fundamentally 2 things, it can break the previous ATH with little correction or it can correct something, for example looking for the 7 / Sep high at $ 52,700 (MINOR 1 Top), and then break the ATH
I mean that now you can be reasonably clear that we would be in MINOR 3, but to know the development of that MINOR 3, I thought you would need a boost and its correction to be seen more clearly. Of course I don't have your skill to see those waves in MINOR 3.
That is, it could be the case that yesterday a maximum was made and a correction of several days began, and it would continue to be valid for the MINOR 3
Jump to: