


BitcointalkSearch
Search easily and fast between all the Bitcointalk topics content.
What's this?

Bitcointalksearch.org - what's this site?
It was the Bitcointalk forum that inspired us to create Bitcointalksearch.org - Bitcointalk is an excellent site that should be the default page for anybody dealing in cryptocurrency, since it is a virtual gold-mine of data. However, our experience and user feedback led us create our site; Bitcointalk's search is slow, and difficult to get the results you need, because you need to log in first to find anything useful - furthermore, there are rate limiters for their search functionality.
The aim of our project is to create a faster website that yields more results and faster without having to create an account and eliminate the need to log in - your personal data, therefore, will never be in jeopardy since we are not asking for any of your data and you don't need to provide them to use our site with all of its capabilities.
We created this website with the sole purpose of users being able to search quickly and efficiently in the field of cryptocurrency so they will have access to the latest and most accurate information and thereby assisting the crypto-community at large.

Author
Topic: 2023 Elliott Wave - page 3. (Read 1461 times)
I don't know what you mean by "earn wave" but it sounds like a lot of people are going to have a hard time predicting the price of Bitcoin.
The thing is, we can't be sure if the price will go up or down in the next 24 hours or even a few hours from now.
If you look at the chart you can see that there is a lot of uncertainty in the price of Bitcoin, which is something that can't be predicted by anything in the market right now.
So, it's not a prediction but a market trend.
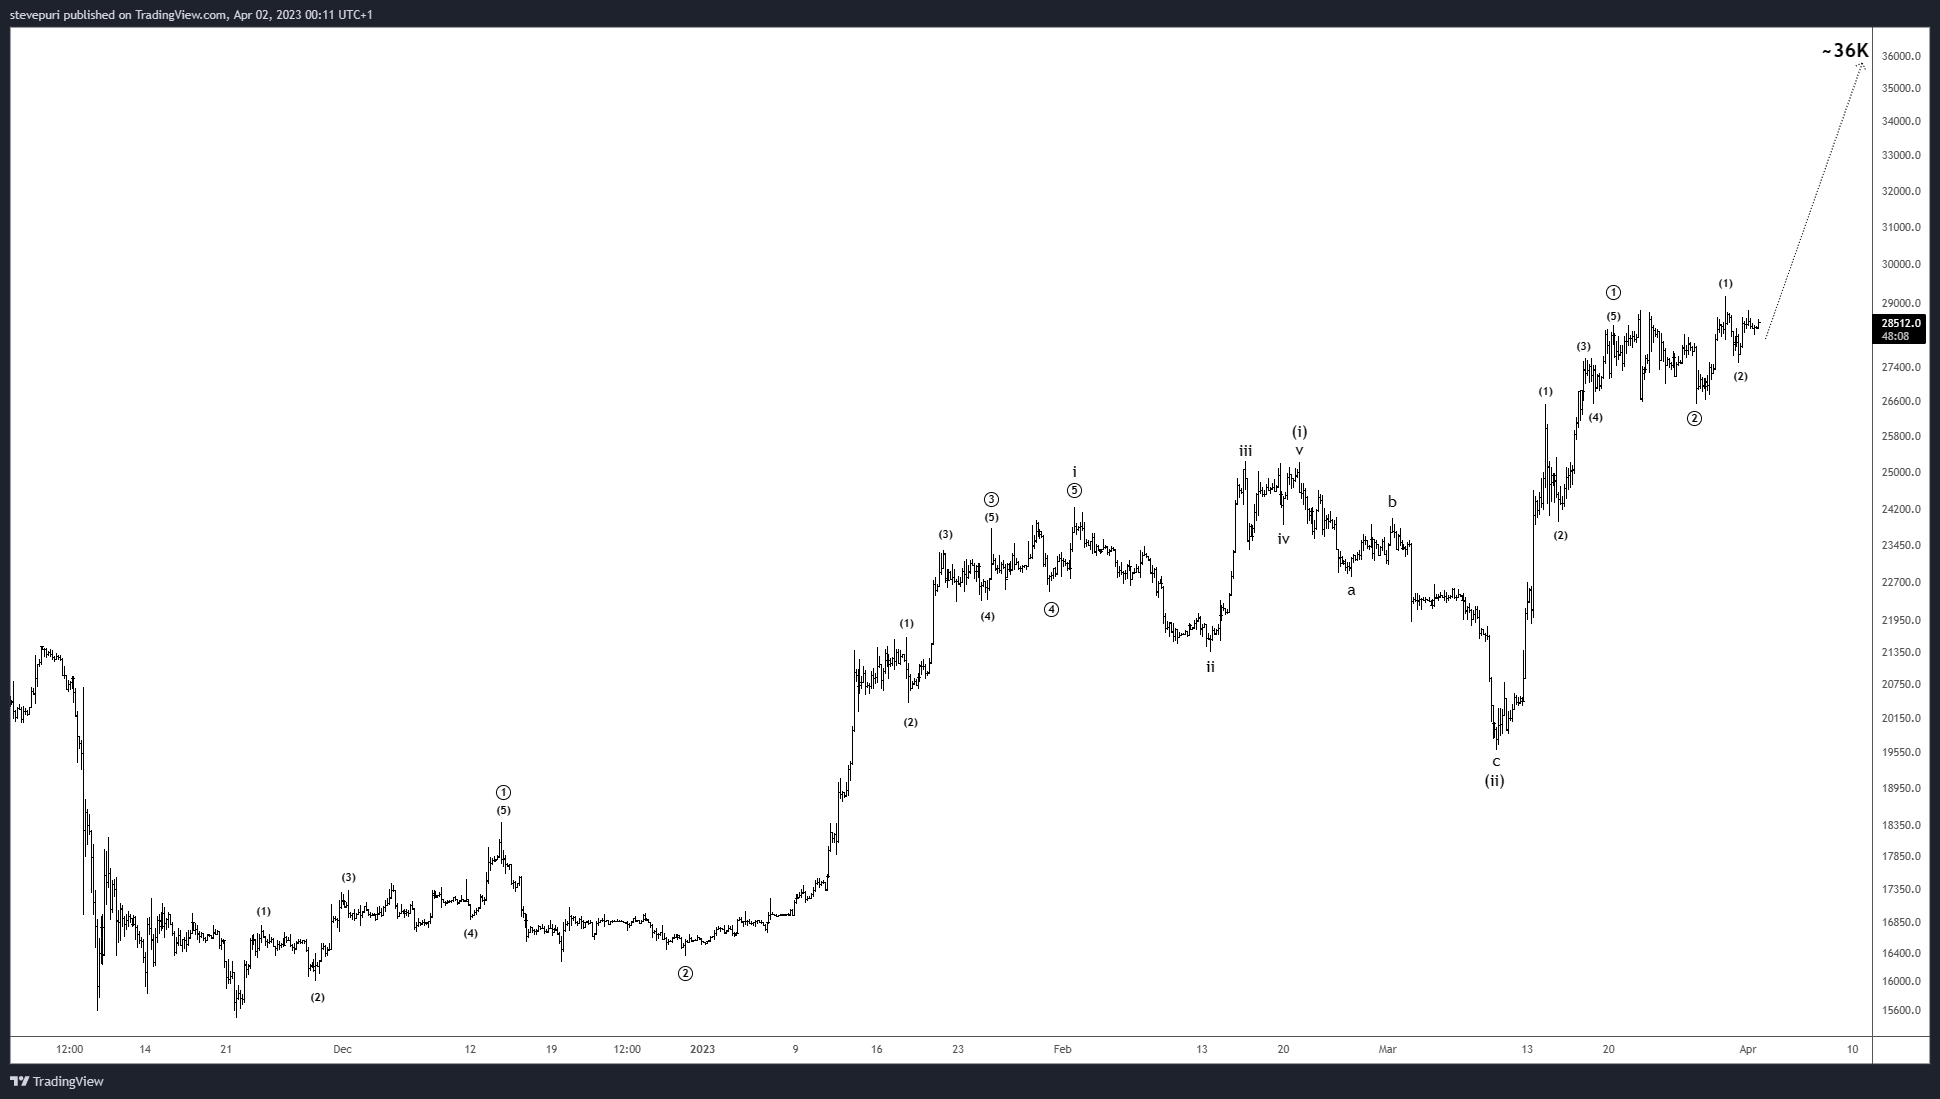
That is the price range we are going to be stuck at for a long time, potentially all year long as well. That's what 36k is, we have 28k at the bottom and 36k at the top and the price will hit 36k this year I believe, sometime not too long in the future neither. But after that, we are going to have hard time breaking over 36k and under 28k and just jump around between those prices. Maybe as further as the halving period as well, remember last time halving happened, we got a little drop first, but then we had a huge increase afterwards.
I think 36k will be broken in 2024, but don't know when it will be, but I highly doubt that it would do that this year. And I think this chart doesn't say it can't be, but that doesn't mean it can neither, shows the potential.
I think 36k will be broken in 2024, but don't know when it will be, but I highly doubt that it would do that this year. And I think this chart doesn't say it can't be, but that doesn't mean it can neither, shows the potential.
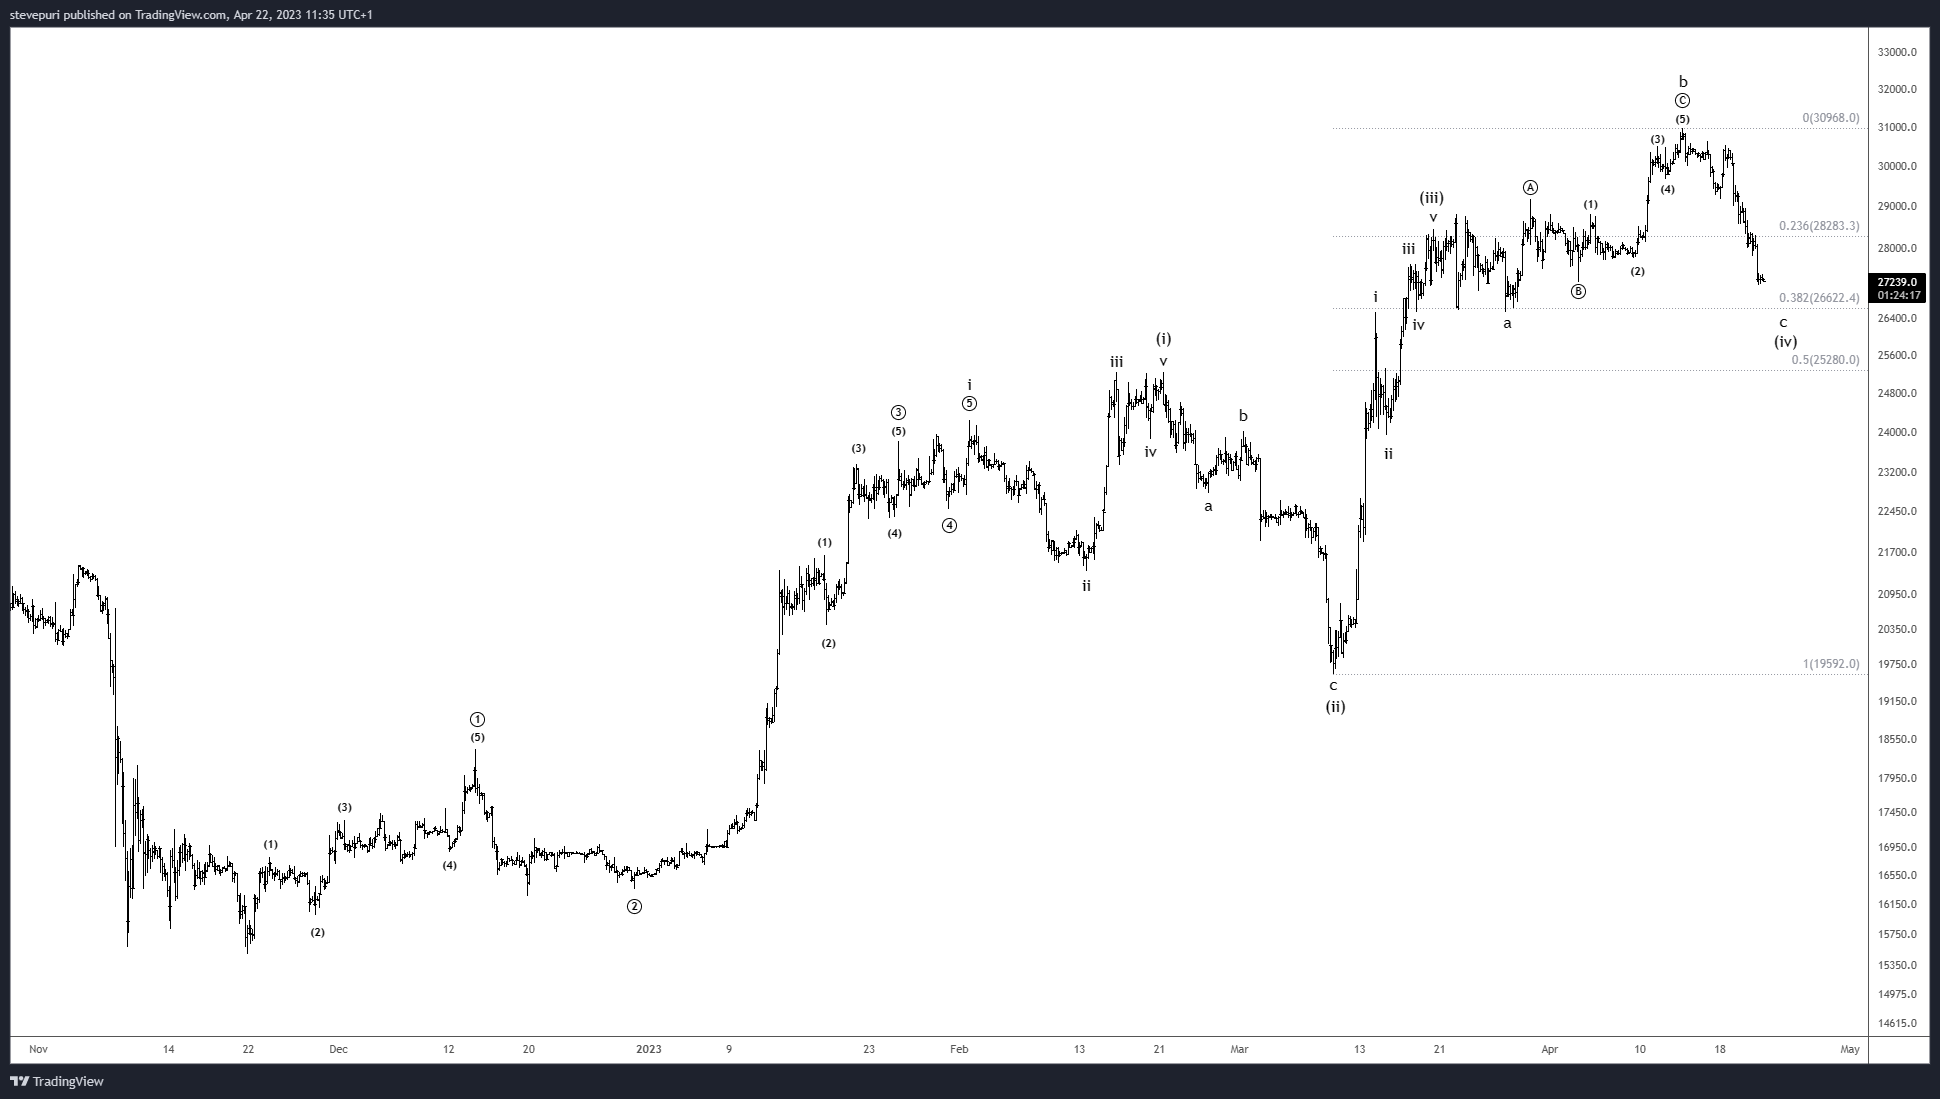
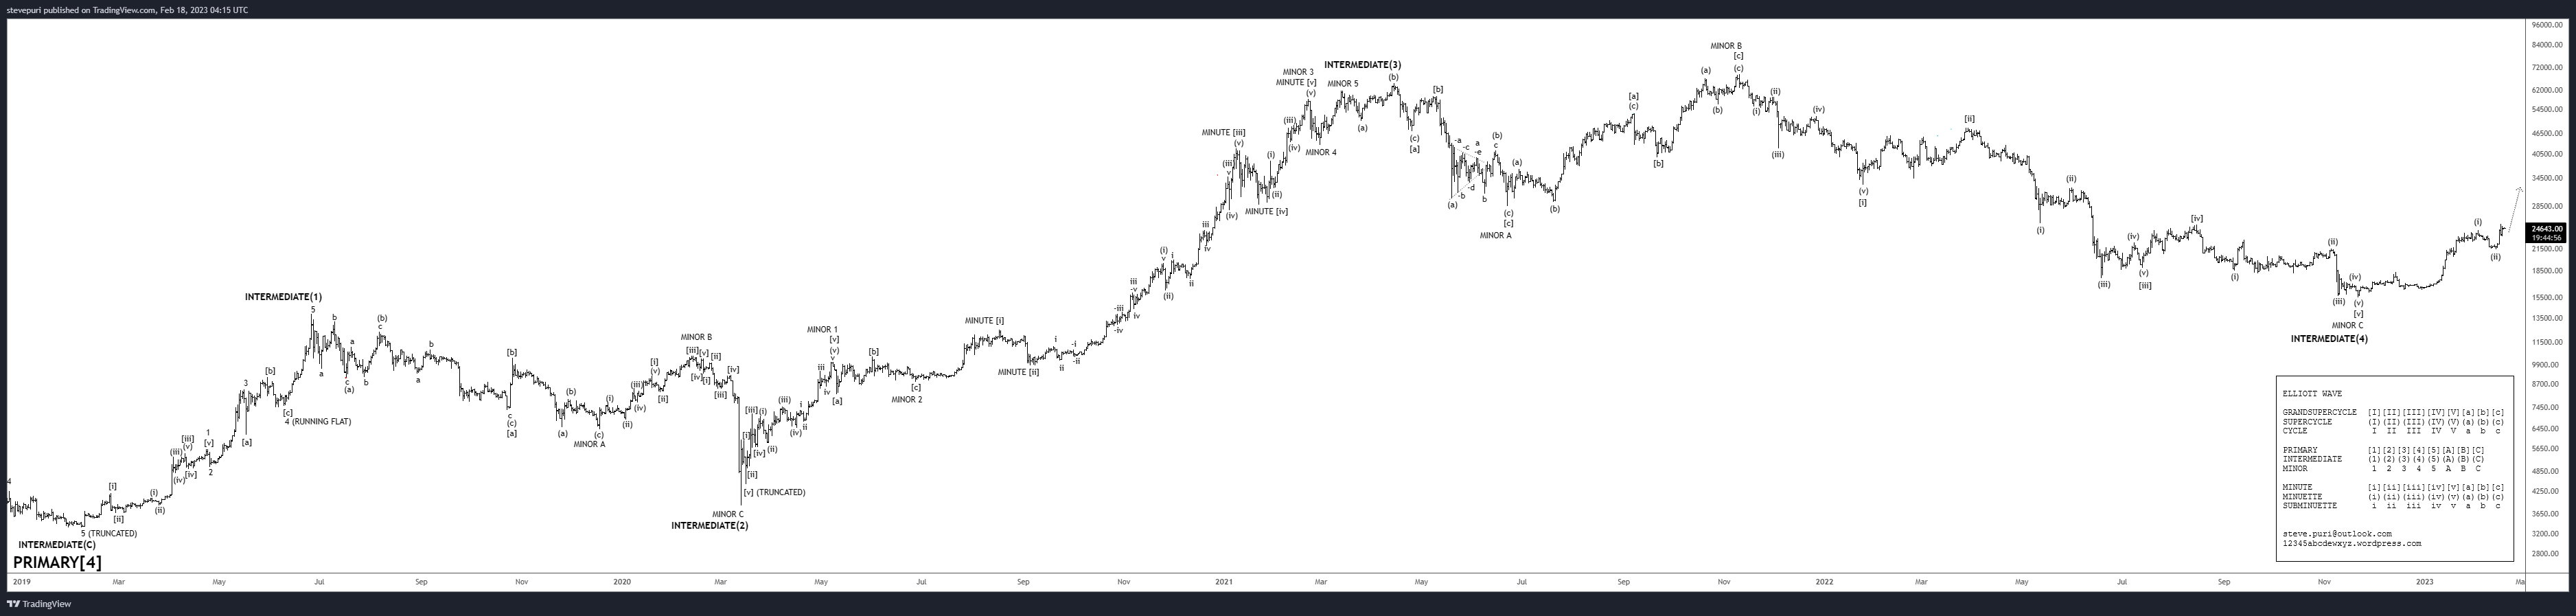
A plausible count to support your thoughts...


That is the price range we are going to be stuck at for a long time, potentially all year long as well. That's what 36k is, we have 28k at the bottom and 36k at the top and the price will hit 36k this year I believe, sometime not too long in the future neither. But after that, we are going to have hard time breaking over 36k and under 28k and just jump around between those prices. Maybe as further as the halving period as well, remember last time halving happened, we got a little drop first, but then we had a huge increase afterwards.
I think 36k will be broken in 2024, but don't know when it will be, but I highly doubt that it would do that this year. And I think this chart doesn't say it can't be, but that doesn't mean it can neither, shows the potential.
I think 36k will be broken in 2024, but don't know when it will be, but I highly doubt that it would do that this year. And I think this chart doesn't say it can't be, but that doesn't mean it can neither, shows the potential.
36k
I see that you mark the 36k,but what would it be?
Are you pointing it out because there could be a significant correction in time or price?
Thanks!
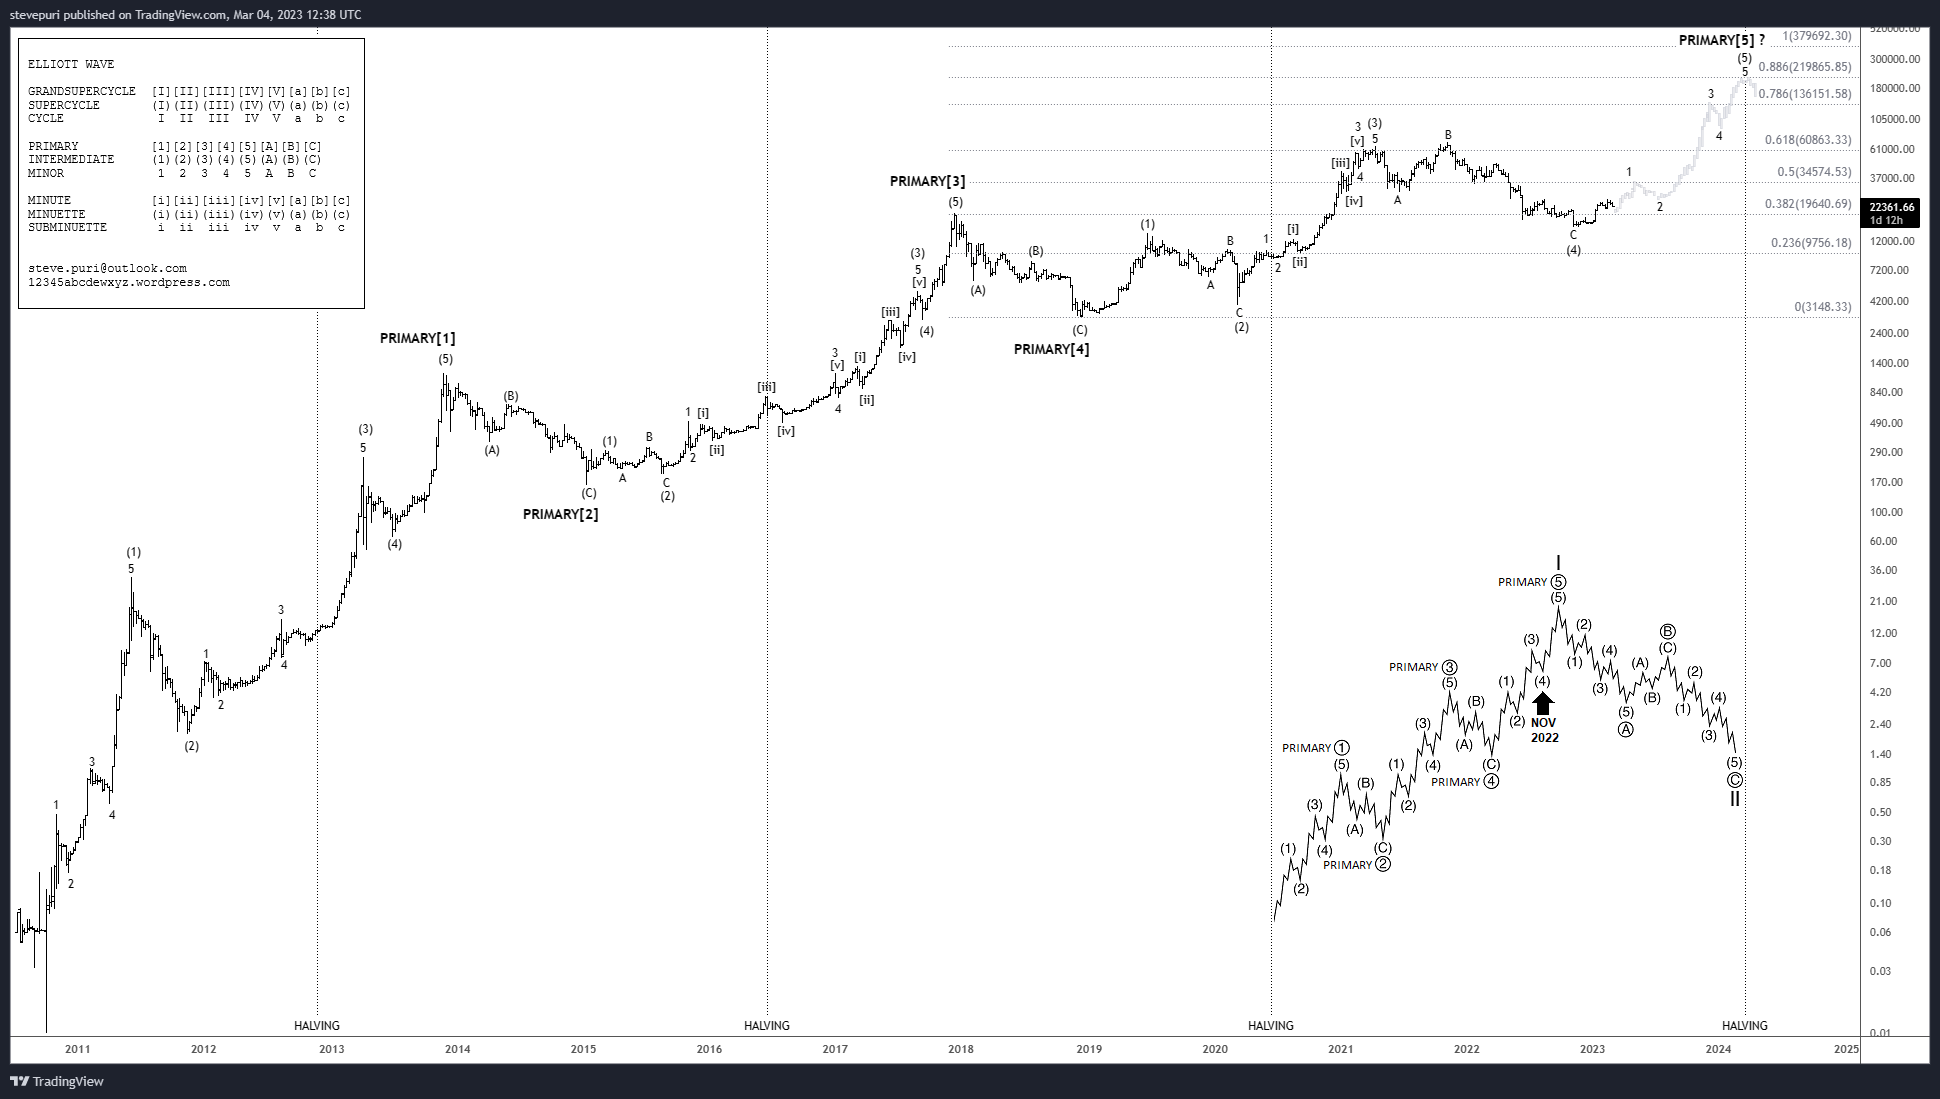
Yes, the following chart suggests potential Fibonnaci-based resistance zones to consider on the linear and logarithmic scales...

36k
I see that you mark the 36k,but what would it be?
Are you pointing it out because there could be a significant correction in time or price?
Thanks!


Congrats, nailed that wave 2.
Guesswork at best; sometimes it works, sometimes it doesn't !
Congrats, nailed that wave 2.


...
Have you set the maximum PRIMARY[5] just coinciding with the halving, was it intentional or by chance?that is, until now the halving date has preceded the most bullish phase, which has lasted several months, it would be the first time that the halving coincides with a maximum.
The ghost grey projection of INTERMEDIATE(5) is more or less based on INTERMEDIATE(3) wave. This is because INTERMEDIATE(3) was the most recent bull market, and may still carry similar socionomic metrics forward in the current INTERMEDIATE(5) bull market.
If INTERMEDIATE(5) unfolds similarly to INTERMEDIATE(3) wave; in time this would approximate near the 2024 Halving.
Just using a historical benchmark of INTERMEDIATE(3) wave at the moment, which will be refined in price and time as the waves and events unfold.
Okay, thank you very much for the clarification.
I see that that would break the current cycle, where the halving is halfway to the maximum.
I suppose that at some point the halving will stop having that influence on the price, although I don't know if it can be now.
...
Have you set the maximum PRIMARY[5] just coinciding with the halving, was it intentional or by chance?that is, until now the halving date has preceded the most bullish phase, which has lasted several months, it would be the first time that the halving coincides with a maximum.
The ghost grey projection of INTERMEDIATE(5) is more or less based on INTERMEDIATE(3) wave. This is because INTERMEDIATE(3) was the most recent bull market, and may still carry similar socionomic metrics forward in the current INTERMEDIATE(5) bull market.
If INTERMEDIATE(5) unfolds similarly to INTERMEDIATE(3) wave; in time this would approximate near the 2024 Halving.
Just using a historical benchmark of INTERMEDIATE(3) wave at the moment, which will be refined in price and time as the waves and events unfold.
...
Have you set the maximum PRIMARY[5] just coinciding with the halving, was it intentional or by chance?that is, until now the halving date has preceded the most bullish phase, which has lasted several months, it would be the first time that the halving coincides with a maximum.
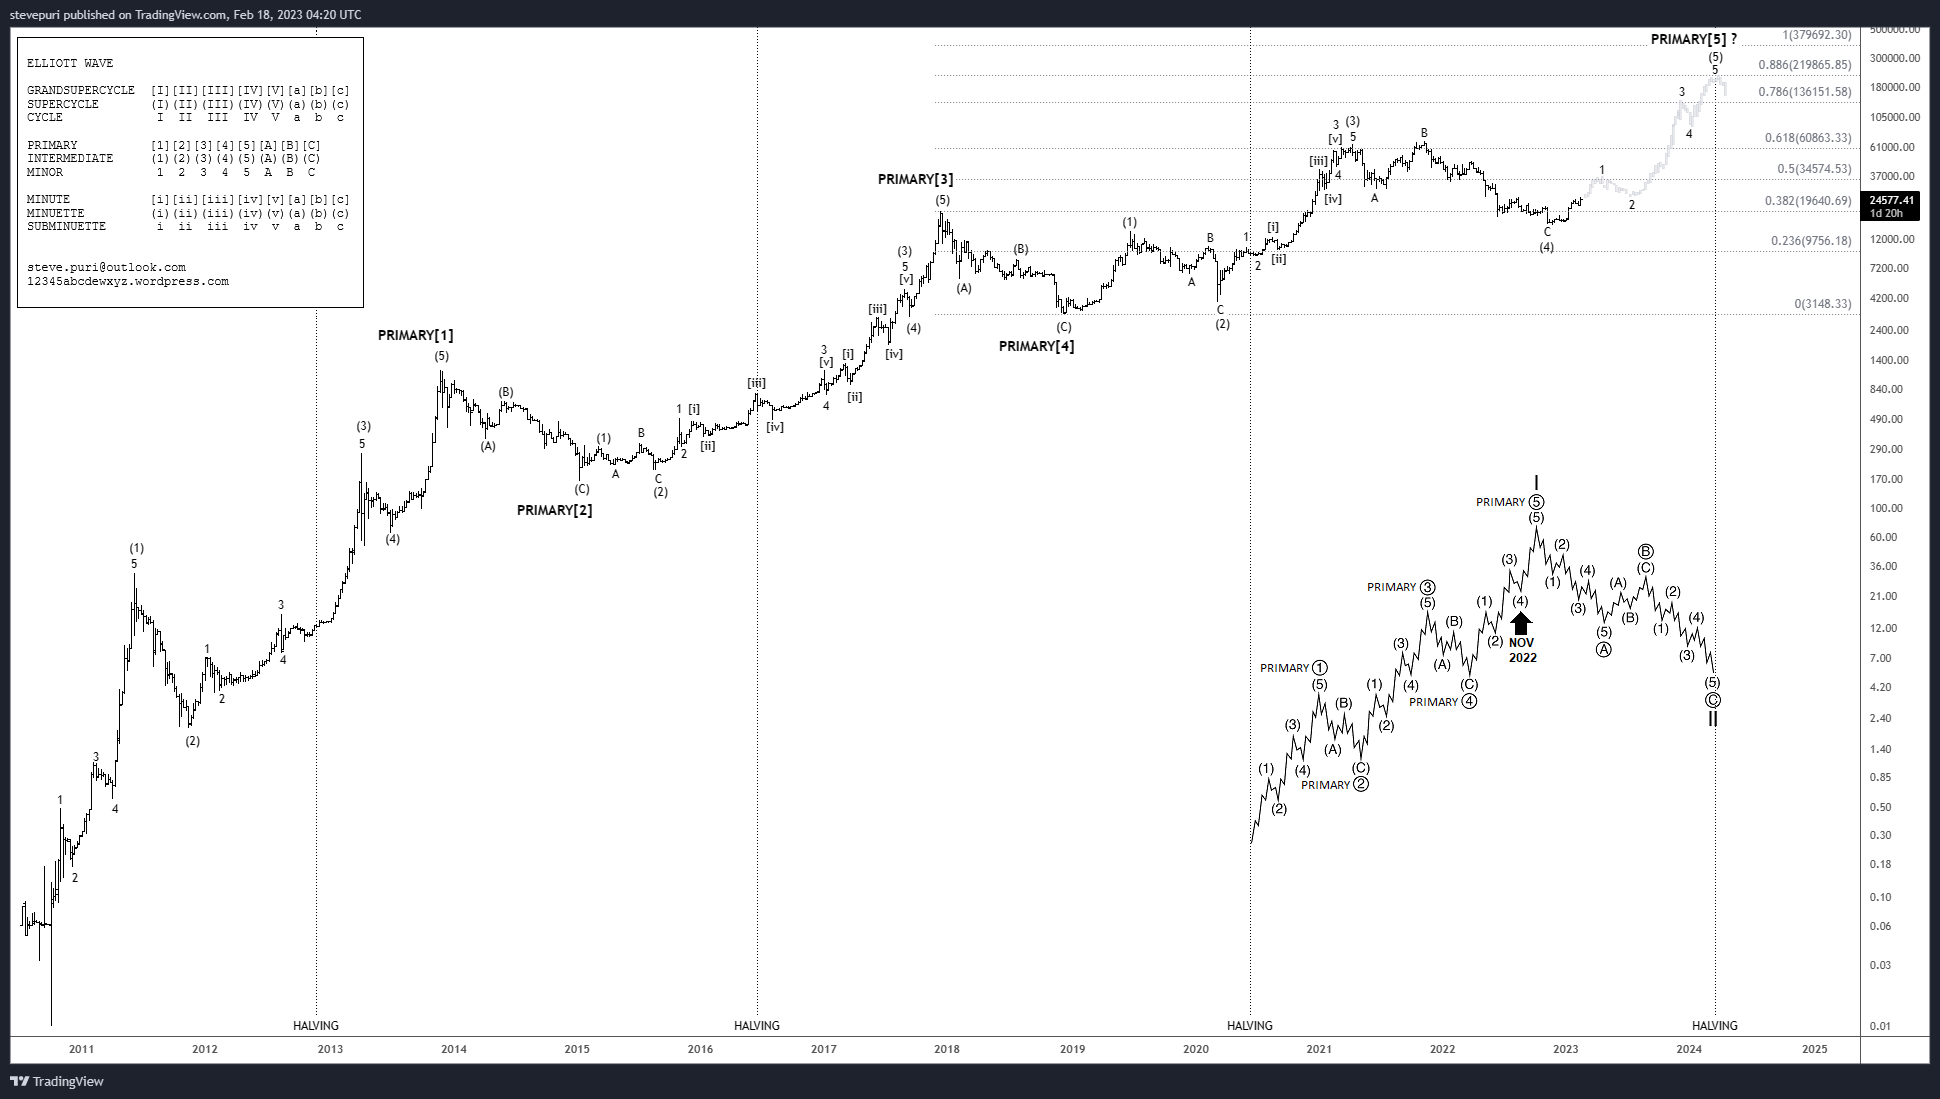
The channel drawn on the Bitcoin chart is not an Elliott Wave channel, its just an arbitrary classical Technical Analysis trendline capturing the most points on a trend; of which, a number of interpretations can be made.
I say again that I am not talking about the channel,I'm talking about line 2-4
And I don't think it's normal for wave 5 PRIMARY to break line extension 2-4
https://i.imgur.com/vNKzeIs.jpg
Don't see it as an issue, happens all the time. If this didn't happen, the charts would be picture perfect and very predictable !
Take a look at Apple: https://i.ibb.co/kcyzMmR/apple.png
ok thanks, I remember reading something about it being a rule, but I'm not much of an Elliot expert.
The channel drawn on the Bitcoin chart is not an Elliott Wave channel, its just an arbitrary classical Technical Analysis trendline capturing the most points on a trend; of which, a number of interpretations can be made.
I say again that I am not talking about the channel,I'm talking about line 2-4
And I don't think it's normal for wave 5 PRIMARY to break line extension 2-4
https://i.imgur.com/vNKzeIs.jpg
Don't see it as an issue, happens all the time. If this didn't happen, the charts would be picture perfect and very predictable !
Take a look at Apple: https://i.ibb.co/kcyzMmR/apple.png
Jump to: